A
B
C
D
Text Solution
AI Generated Solution
The correct Answer is:


Similar Questions
Explore conceptually related problems
Recommended Questions
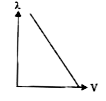
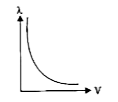
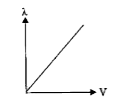
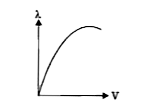
- Which of the following graphs shows the variation of de-Broglie wavele...
Text Solution
|
- Show graphically, the variation of the de-Broglie wavelength (lambda) ...
Text Solution
|
- Draw a graph showing the variation of de Broglie wavelength of a parti...
Text Solution
|
- किसी आवेशित कण का द्रवमान m तथा इस पर आवेश q हैं । कण को V विभवान्तर स...
Text Solution
|
- किसी आवेशित कण का द्रवमान m तथा इस पर q आवेश हैं । यदि कण V विभवान्तर ...
Text Solution
|
- द्रव्यमान m तथा आवेश q के एक कण को V विभव द्वारा त्वरित किया जाता है। ...
Text Solution
|
- The de-Broglie wavelength lambda associated with charged particle of c...
Text Solution
|
- Write the expression for the de Broglie wavelength associated with a c...
Text Solution
|
- Write the expression for the de Broglie wavelength associated with a c...
Text Solution
|