A
B
C
D
Text Solution
Verified by Experts
The correct Answer is:


Similar Questions
Explore conceptually related problems
Recommended Questions
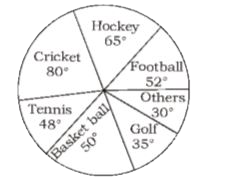
- The given pie chart shows expenditure on different type of sport in a ...
Text Solution
|
- The given pie chart depicts the expenditure incurred in crores towards...
Text Solution
|
- The given pie chart shows expenditure on different type of sport in a ...
Text Solution
|
- The given pie chart shows expenditure on different type of sport in a ...
Text Solution
|
- The given pie chart shows expenditure on different type of sport in a ...
Text Solution
|
- The given pie chart shows the expenditure in crores on each game. In t...
Text Solution
|
- The given pie-chart shows the expenditure of a country on various spor...
Text Solution
|
- The given pie-chart shows the expenditure of a country on various spor...
Text Solution
|
- The pie-chart given here shows expenditures incurred by a family on va...
Text Solution
|