A
B
C
D
Text Solution
Verified by Experts
The correct Answer is:


Similar Questions
Explore conceptually related problems
Recommended Questions
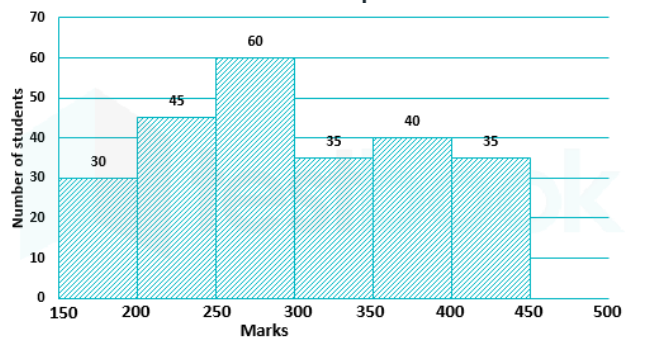
- Study the given histogram that shows the marks obtained by students in...
Text Solution
|
- Match the following Column A to Column B
Text Solution
|
- The inequation represented by the graph given below is : <img src="htt...
Text Solution
|
- The pie chart gives the marks scored in an examination by a student in...
Text Solution
|
- The given graph shows the marks obtained by students in an examination...
Text Solution
|
- The given pie-chart shows the marks obtained (in degrees) by a student...
Text Solution
|
- The given pie-chart shows the marks obtained (in degrees) by a student...
Text Solution
|
- The given pie chart shows the marks obtained in an examination by a st...
Text Solution
|
- The given pie chart shows the marks obtained in an examination by a st...
Text Solution
|