A
B
C
D
Text Solution
Verified by Experts
The correct Answer is:


Similar Questions
Explore conceptually related problems
Recommended Questions
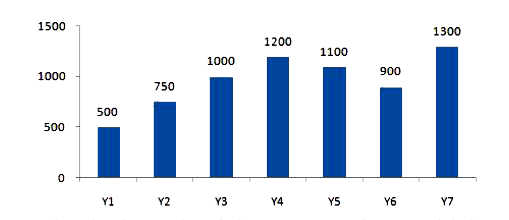
- The bar charg given below shows the total exports (in =1000 crores) of...
Text Solution
|
- If y = sin px and yn is the nth derivative of y , then find the value ...
Text Solution
|
- Match the following Column A to Column B
Text Solution
|
- The inequation represented by the graph given below is : <img src="htt...
Text Solution
|
- The inequation that best describes the graph given below is <img src=...
Text Solution
|
- In which financial year, total of Exports and Imports is the highest?
Text Solution
|
- The given bar graph presents the Imports and Exports of an item manufa...
Text Solution
|
- Ratio of imports and exports of a company from year to year If the tot...
Text Solution
|
- Import and export value of a company in different years (Rs. in crore)...
Text Solution
|