A
B
C
D
Text Solution
Verified by Experts
The correct Answer is:


Topper's Solved these Questions
Similar Questions
Explore conceptually related problems
CENGAGE PHYSICS-DESCRIPTION OF MOTION-OLYMPIAD AND NTSE LEVEL EXERCISE
- A point moves with uniform acceleration and v1, v2 and v3 denote the a...
Text Solution
|
- Two cars A and B are travelling in the same direction with velocities ...
Text Solution
|
- A particle is dropped vertically from rest from a height. The time tak...
Text Solution
|
- Two trains, which are moving along different tracks in opposite direct...
Text Solution
|
- Each of the three graphs represents acceleration versus time for an ob...
Text Solution
|
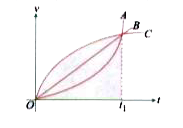
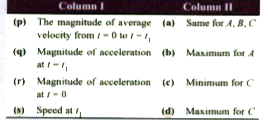
- v - t graph for rectilinear motion is given as shown in the figure. Ma...
Text Solution
|
- The position of a particle moving along the x-axis at certain times is...
Text Solution
|
- Mr. Verma drives his car at uniform speed from bottom of a mountain to...
Text Solution
|
- Mr. Verma drives his car at uniform speed from bottom of a mountain to...
Text Solution
|
- Mr. Verma drives his car at uniform speed from bottom of a mountain to...
Text Solution
|