


Topper's Solved these Questions
Similar Questions
Explore conceptually related problems
NCERT TELUGU-ADAPTATIONS IN DIFFERENT ECOSYSTEM-EXERCISE
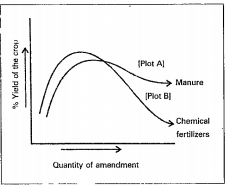
- The given figure shows the two crop fields (plots A and B) have been t...
Text Solution
|
- Reindeer can be seen in
Text Solution
|
- What kind of change did you obesrve in the leaves ?
Text Solution
|
- Which zone do you think, when compared to marine ecosystem, is absent ...
Text Solution
|
- What are the adaptations in desert plants?
Text Solution
|
- What are living stones?
Text Solution
|
- What are the adaptations seen in camel to withstand the extreme weathe...
Text Solution
|
- Which animal can survive without water throughout its life? How?
Text Solution
|
- What are the adaptations seen in nocturnal animals?
Text Solution
|
- What is the advantage of swim bladder to some types of fish?
Text Solution
|
- Write about bathyal zone.
Text Solution
|
- What is the littoral zone? Where is it present? What are the organisms...
Text Solution
|
- Write about the limnetic zone?
Text Solution
|
- How do webbed feet help water animals?
Text Solution
|
- What are the adaptations in Aquatic plants?
Text Solution
|
- What are the adaptations in hydrilla that give an advantage over other...
Text Solution
|
- How do the plants in temperate regions adapt to the environment they l...
Text Solution
|
- The aquatic ecosystem of coringa mangrove region would be less saltier...
Text Solution
|
- Give examples of desert plants.
Text Solution
|
- What are xerophytes?
Text Solution
|
- Name some aquatic plants.
Text Solution
|