Home
Class 9
MATHS
Read the bar graph shown in fig. and ans...

Read the bar graph shown in fig. and answer the following questions

What was the number of commercial banks in 2010?

Promotional Banner

Topper's Solved these Questions

  • STATISTICS

    MODERN PUBLICATION|Exercise EXERCISE|239 Videos
  • QUADRILATERALS

    MODERN PUBLICATION|Exercise EXERCISE|133 Videos
  • SURFACE AREAS AND VOLUMES

    MODERN PUBLICATION|Exercise EXERCISE|228 Videos

Similar Questions

Explore conceptually related problems

Read the bar graph shown in fig. and answer the following questions The number of commercial banks in 2016 is less than double the number of commercial banks in 2008.

Read the bar graph shown in fig. and answer the following questions What is the ratio of the number of commercial banks in 2008 to that in 2014?

Read the bar graph shown in fig. and answer the following questions What is the number of students wearing shoe NO. 5?

Read the bar graph shown in fig. and answer the following questions Which shoe number is worn by the minimum number of students? Also give the number.

Read the bar graph shown in fig. and answer the following questions What is the information given by the bar graph.

Read the bar graph shown in fig. and answer the following questions What is the information given by the bar graph?

Read the bar graph shown in fig. and answer the following questions Of which state were the maximum number of tickets sold?

Read the bar graph shown in fig. and answer the following questions Of which state were the minimum number of tickets sold?

Read the bar graph shown in fig. and answer the following questions Which shoe number is worn by the maximum number of students? Also give its number.

Read the bar graph shown in fig. and answer the following questions The maximum number of tickets sold is three times the minimum number of tickets sold.

MODERN PUBLICATION-STATISTICS-EXERCISE
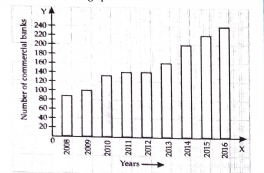
  1. Read the bar graph shown in fig. and answer the following questions O...

    Text Solution

    |

  2. Read the bar graph shown in fig. and answer the following questions W...

    Text Solution

    |

  3. Read the bar graph shown in fig. and answer the following questions W...

    Text Solution

    |

  4. Read the bar graph shown in fig. and answer the following questions W...

    Text Solution

    |

  5. Read the bar graph shown in fig. and answer the following questions T...

    Text Solution

    |

  6. What is the information given y the bar graph

    Text Solution

    |

  7. The number of governement companies in 1996 is that of 2011 of 1:9

    Text Solution

    |

  8. The number of government companies have decreased over the year 1998 t...

    Text Solution

    |

  9. Read the following bar graph and answer the following questions What ...

    Text Solution

    |

  10. Read the following bar graph and answer the following questions Which...

    Text Solution

    |

  11. Read the following bar graph and answer the following questions Which...

    Text Solution

    |

  12. Read the following bar graph and answer the following questions Which...

    Text Solution

    |

  13. Read the following bar graph and answer the following questions Which...

    Text Solution

    |

  14. Read the following the bar graph in fig. and answer the following ques...

    Text Solution

    |

  15. Read the following the bar graph in fig. and answer the following ques...

    Text Solution

    |

  16. Read the following the bar graph in fig. and answer the following ques...

    Text Solution

    |

  17. What information does it gave?

    Text Solution

    |

  18. In which part the expenditure on education is maximum in 2000?

    Text Solution

    |

  19. In which part the expenditure has gone up from 2000 to 2012?

    Text Solution

    |

  20. In which part the gap between 2000 to 2012 is maximum?

    Text Solution

    |