


Topper's Solved these Questions
Similar Questions
Explore conceptually related problems
MODERN PUBLICATION-STATISTICS-EXERCISE
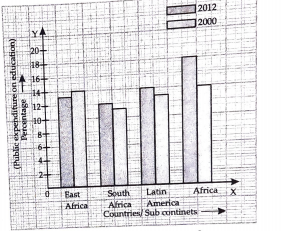
- What information does it gave?
Text Solution
|
- In which part the expenditure on education is maximum in 2000?
Text Solution
|
- In which part the expenditure has gone up from 2000 to 2012?
Text Solution
|
- In which part the gap between 2000 to 2012 is maximum?
Text Solution
|
- The daily wages of 50 workers in a factory are given below: Construct...
Text Solution
|
- Draw a histogram for the frequency distributions of the following data
Text Solution
|
- The following table shows the number of illiterate persons in the age ...
Text Solution
|
- Construct a histogram for the following data:
Text Solution
|
- Draw a histogram for the daily earnings of 30 drug stores in the follo...
Text Solution
|
- The ages of 360 patients treated in a hospital on a particular day are...
Text Solution
|
- Draw a frequency polygon for the following frequency distribution
Text Solution
|
- Draw a histogram for the following data:
Text Solution
|
- The following is the distribution of total household expenditure of ma...
Text Solution
|
- The montly profits of 100 shops are distributed as follows Draw a hist...
Text Solution
|
- Find the mean of first five natural numbers.
Text Solution
|
- Find the mean of all factors of 10.
Text Solution
|
- Find the arithmetic mean of first ten even natural numbers.
Text Solution
|
- The number of children in 10 families of a locality are: 2,4,3,4,2,0,3...
Text Solution
|
- Find the mean of first five multiples of 3.
Text Solution
|
- The number of children in 10 families of a locality are: 2,4,3,4,2,0,3...
Text Solution
|