Home
Class 9
MATHS
The ages of 360 patients treated in a ho...

The ages of 360 patients treated in a hospital on a particular day are given below

Draw a histogram and the frequency polygon on the same grap to represent the above data.

Promotional Banner

Topper's Solved these Questions

  • STATISTICS

    MODERN PUBLICATION|Exercise EXERCISE|239 Videos
  • QUADRILATERALS

    MODERN PUBLICATION|Exercise EXERCISE|133 Videos
  • SURFACE AREAS AND VOLUMES

    MODERN PUBLICATION|Exercise EXERCISE|228 Videos

Similar Questions

Explore conceptually related problems

The daily pocket expenses of 206 students in a school are given below construct a fequency polygon representing the above data.

Consider the marks out of 100, obtained by 51 students of a class in a test, given in table below: Draw a historigram and frequency polygon for the above data.

Following table shows a frequeny ditribution for the speed of cars pasing through a particular spot on a high way, draw the histogram and frequency polygon representing the data above.

In a city, the following weekly observations were made in a study on cost of living index : Draw a histogram and frequency polygon for the above data on the same graph.

The daily wages of 50 workers in a factory are given below: Construct a histogram to represent the above frequency distribution.

Following are the ages of 360 patients getting medical treatment in a hospital Construct a commulative frequency table for the above data.

The marks obtained of a class of 80 students are given below Construct a histogram to represent the data above.

The following table shows the number of illiterate persons in the age group in a town Draw a histogram to represent the above data.

In a city, the weekly observations made in a study on the cost of living index are given in the following table: Draw a frequency polygon for the data above (without constructing a histogram).

MODERN PUBLICATION-STATISTICS-EXERCISE
  1. Construct a histogram for the following data:

    Text Solution

    |

  2. Draw a histogram for the daily earnings of 30 drug stores in the follo...

    Text Solution

    |

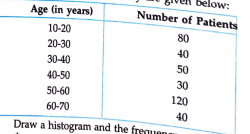
  3. The ages of 360 patients treated in a hospital on a particular day are...

    Text Solution

    |

  4. Draw a frequency polygon for the following frequency distribution

    Text Solution

    |

  5. Draw a histogram for the following data:

    Text Solution

    |

  6. The following is the distribution of total household expenditure of ma...

    Text Solution

    |

  7. The montly profits of 100 shops are distributed as follows Draw a hist...

    Text Solution

    |

  8. Find the mean of first five natural numbers.

    Text Solution

    |

  9. Find the mean of all factors of 10.

    Text Solution

    |

  10. Find the arithmetic mean of first ten even natural numbers.

    Text Solution

    |

  11. The number of children in 10 families of a locality are: 2,4,3,4,2,0,3...

    Text Solution

    |

  12. Find the mean of first five multiples of 3.

    Text Solution

    |

  13. The number of children in 10 families of a locality are: 2,4,3,4,2,0,3...

    Text Solution

    |

  14. The following are the number of books issued in a school library durin...

    Text Solution

    |

  15. If the arithmetic mean of 7,9,1,13,x,21 is 13, find the value of x.

    Text Solution

    |

  16. The mean of 20 numbers is 43, if 6 is subtracted from each of the numb...

    Text Solution

    |

  17. The mean of 12 numbers is 40. if each numbers if divided by 8, what wi...

    Text Solution

    |

  18. The mean of 20 numbers is 18, if 3 is added to each of the first ten n...

    Text Solution

    |

  19. The mean of 100 items was found to be 64. later on, it was discovered ...

    Text Solution

    |

  20. The mean of 200 items was 50. later on, it was discovered that the two...

    Text Solution

    |