


Topper's Solved these Questions
Similar Questions
Explore conceptually related problems
MODERN PUBLICATION-STATISTICS-EXERCISE
- A survey conducted by an organisation for the cause of illness and dea...
Text Solution
|
- A survey conducted by an organisation for the cause of illness and dea...
Text Solution
|
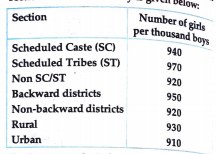
- The following data on the number of girls per thousand boys in differe...
Text Solution
|
- The following data on the number of girls per thousand boys in differe...
Text Solution
|
- Given below are the seats won by different political parties in the po...
Text Solution
|
- Given below are the seats won by different political parties in the po...
Text Solution
|
- The length of 40 leaves of a plant are measured correct to one millime...
Text Solution
|
- The length of 40 leaves of a plant are measured correct to one millime...
Text Solution
|
- The length of 40 leaves of a plant are measured correct to one millime...
Text Solution
|
- The following table gives the distribution of students of two sections...
Text Solution
|
- The runs scored by two teams A and B in the first 60 balls in a cricke...
Text Solution
|
- 100 surnames were randomly picked up from a local telephone directory ...
Text Solution
|
- 100 surnames were randomly picked up from a local telephone directory ...
Text Solution
|
- Mean, median and mode are measured in same units. Is it true?
Text Solution
|
- Class mark of 60-90 is 75. Is it true?
Text Solution
|
- If the mean of 2,4,6,8,a,b is 5, find a+b.
Text Solution
|
- If the median of x/2,x/3,x/4,x/5 and x/6(x>0) is 6. then find x/6.
Text Solution
|
- If the median of 33,28,20,25,34,x is 29. find the maximum value of x.
Text Solution
|
- If the mode of 13,14,15,14,16,15,x is 14, find the value of x.
Text Solution
|
- If barx represents the mean of n observations x1, x2,…….,xn , then val...
Text Solution
|