Home
Class 9
MATHS
The following table gives the distributi...

The following table gives the distribution of students of two sections according to the marks obtained by them :
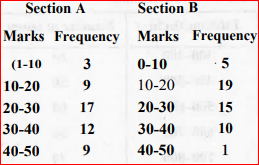
: Represent the marks of the students of both the sections on the same graph by two frequency polygons. From the two polygons compare the performance of the twosections.

Promotional Banner

Topper's Solved these Questions

  • STATISTICS

    MODERN PUBLICATION|Exercise EXERCISE|239 Videos
  • QUADRILATERALS

    MODERN PUBLICATION|Exercise EXERCISE|133 Videos
  • SURFACE AREAS AND VOLUMES

    MODERN PUBLICATION|Exercise EXERCISE|228 Videos

Similar Questions

Explore conceptually related problems

The runs scored by two teams A and B in the first 60 balls in a cricket match are given below : : Represent the data of both the teams on the same graph by frequency polygons.

Consider the marks out of 100, obtained by 51 students of a class in a test, given in table below: Draw a historigram and frequency polygon for the above data.

Out of 100 students, two sections of 40 and 60 are formed. If you and your friend are among the 100 students, what is the probability that you both enter the same section?

The following distribution gives the state-wise teacher-student ratio in higher secondary schools of India. Find the mode and mean of this data.Interpret, the two measures.

Following data gives total marks (out of 600) obtained by six students of a particular class. Represent the data on a bar graph.

Out of 100 students, two sections of 40 and 60 are formed. If you and your friend are among the 100 students, what is the probability that you both enter the different sections?

The following data gives the marks out of 50, obtained by 25 students of a class in a test 32,23,22,18,42,18,20,17,12,9,11 Arrange them in ascending order

A teacher analyses the performance of two sections of students in a mathematics test of 100 marks given in the following table : : Find the probability that a student obtained 60 or above

A teacher analyses the performance of two sections of students in a mathematics test of 100 marks given in the following table : : Find the probability that a student obtained less than 20 marks in the mathematics test.

A teacher analyses the performance of two sections of students in a mathematics test of 100 marks given in the following table : : Find the probability that a student obtained less than 20% in the mathematics test.

MODERN PUBLICATION-STATISTICS-EXERCISE
  1. The length of 40 leaves of a plant are measured correct to one millime...

    Text Solution

    |

  2. The length of 40 leaves of a plant are measured correct to one millime...

    Text Solution

    |

  3. The following table gives the distribution of students of two sections...

    Text Solution

    |

  4. The runs scored by two teams A and B in the first 60 balls in a cricke...

    Text Solution

    |

  5. 100 surnames were randomly picked up from a local telephone directory ...

    Text Solution

    |

  6. 100 surnames were randomly picked up from a local telephone directory ...

    Text Solution

    |

  7. Mean, median and mode are measured in same units. Is it true?

    Text Solution

    |

  8. Class mark of 60-90 is 75. Is it true?

    Text Solution

    |

  9. If the mean of 2,4,6,8,a,b is 5, find a+b.

    Text Solution

    |

  10. If the median of x/2,x/3,x/4,x/5 and x/6(x>0) is 6. then find x/6.

    Text Solution

    |

  11. If the median of 33,28,20,25,34,x is 29. find the maximum value of x.

    Text Solution

    |

  12. If the mode of 13,14,15,14,16,15,x is 14, find the value of x.

    Text Solution

    |

  13. If barx represents the mean of n observations x1, x2,…….,xn , then val...

    Text Solution

    |

  14. The mid value of a class interval is 42 and the class size is 10. find...

    Text Solution

    |

  15. Let barx be the mean of x1,x2,……,xn and bary the mean of y1,y2……,yn ba...

    Text Solution

    |

  16. If each observation of a data is increased by 3, then what about the n...

    Text Solution

    |

  17. True/false Mean, Median and Mode are measures in same units.

    Text Solution

    |

  18. True/false Class Mark of 90-120 is 100.

    Text Solution

    |

  19. True/false Mode of 2,3,9,16,3,9, is 16.

    Text Solution

    |

  20. True/false For the set of numbers 2,2,4,5 and 12, then Mean>mode

    Text Solution

    |