A
B
C
D
Text Solution
Verified by Experts


Topper's Solved these Questions
Similar Questions
Explore conceptually related problems
MODERN PUBLICATION-STATISTICS-EXERCISE
- Let barx be the mean of x1,x2,……,xn and bary the mean of y1,y2……,yn ba...
Text Solution
|
- The mean of 100 items was found to be 64. later on, it was discovered ...
Text Solution
|
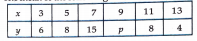
- The mean of the following table is 8 The value of p is
Text Solution
|
- The median of the number 84,78,54,45,68,22,34,45,39,54 is
Text Solution
|
- Mode of the data 15, 14, 19, 20, 14, 15, 1 6, 14, 15, 18, 14, 19, 15, ...
Text Solution
|
- In a histogram, each class rectangle is constructed with base as
Text Solution
|
- A histogram is a pictorail representation of the frequency data in whi...
Text Solution
|
- In the less than type of ogive the comulative frequency is plotted aga...
Text Solution
|
- In a histogram the area of each rectangle is proportional to
Text Solution
|
- In a frequency distribution, gives are graphical represented of
Text Solution
|
- The class mark of the class 90-120 is
Text Solution
|
- The range of the data: 27,18,20,16,6,17,15,12,30,32,10,19,8,11,20 is
Text Solution
|
- In a frequency distribution, the mid value of a class is 10 and width ...
Text Solution
|
- The width of each of five continuous classes in a frequency distibutio...
Text Solution
|
- Let m be the mid-point and l be the upper class limit of a class in a ...
Text Solution
|
- The class marks of a frequency distribution are given as follows : 15,...
Text Solution
|
- In the class intervals 10-20, 20-30, the number 20 is included in.
Text Solution
|
- A grouped frequency table with class intervals of equal sizes using 25...
Text Solution
|
- A grouped frequency distribution table with classes of equal sizes usi...
Text Solution
|
- To draw a histogram to represent the following frequency distribution ...
Text Solution
|