A
B
C
D
Text Solution
Verified by Experts
The correct Answer is:


Similar Questions
Explore conceptually related problems
Recommended Questions
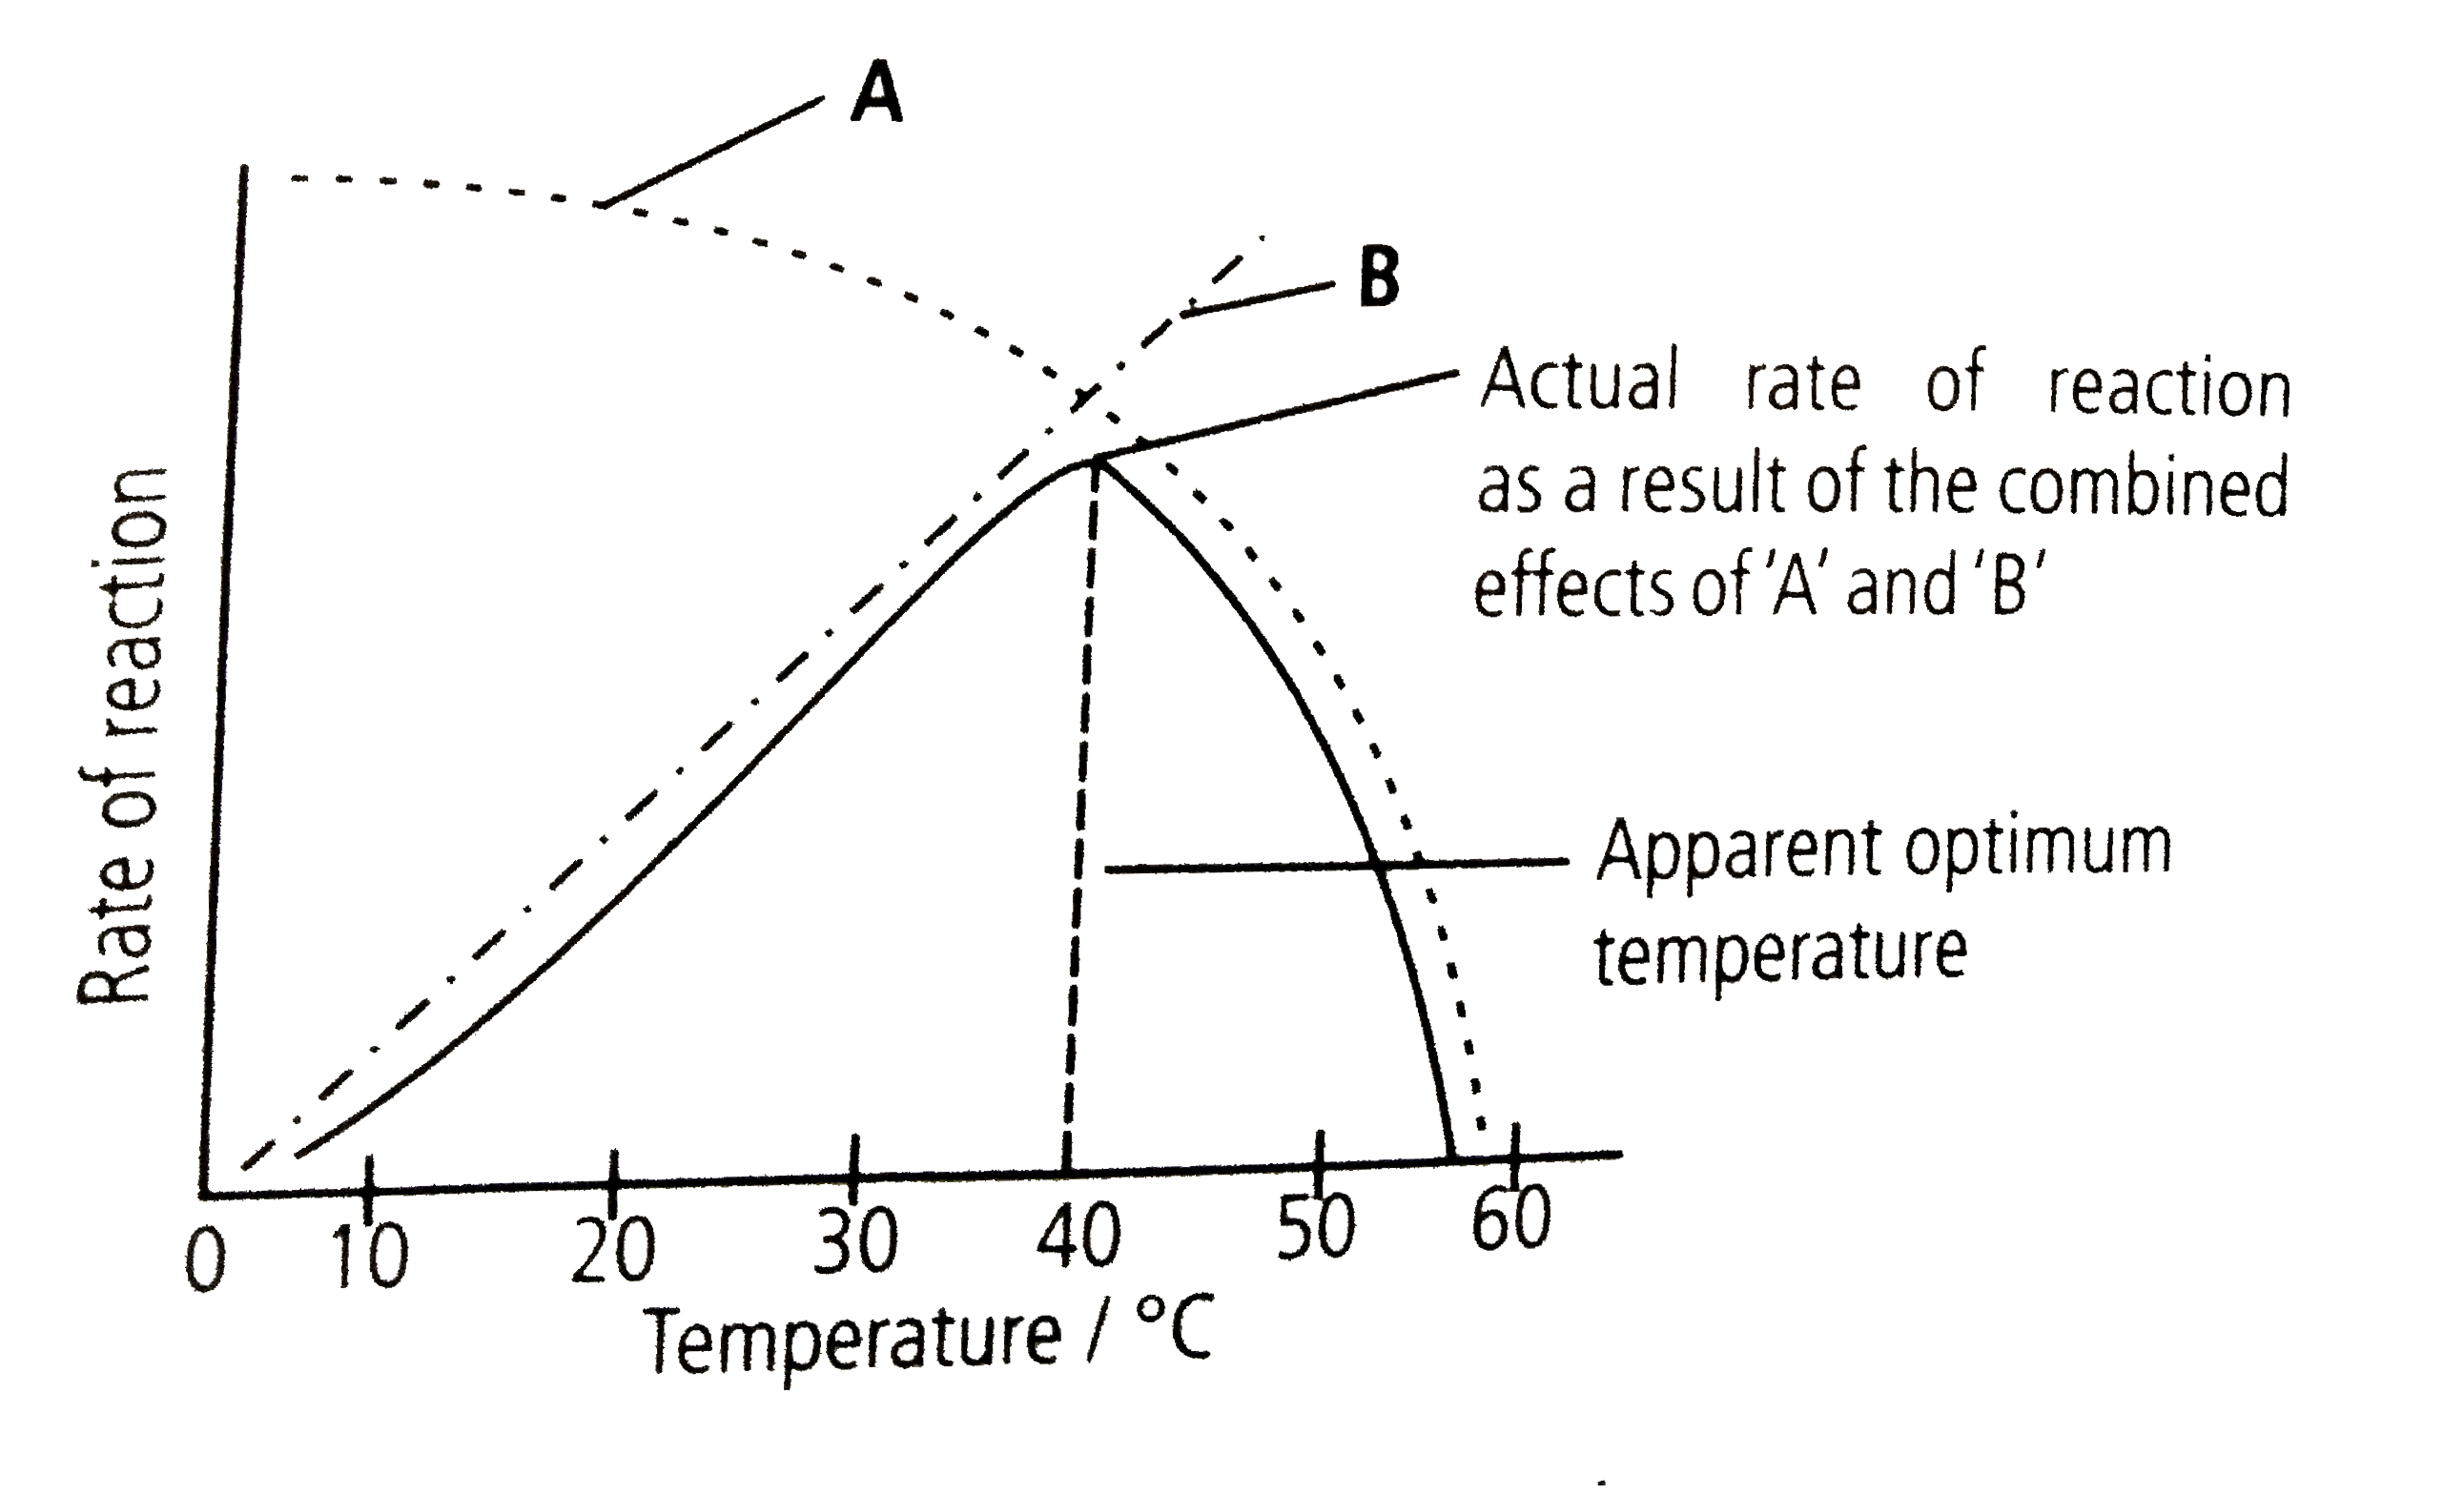
- Refer to the given graph showing relationship between temperature and ...
Text Solution
|
- Refer to the given graph showing relationship between temperature and ...
Text Solution
|
- The given graph depicts the effect of temperature on the activity of t...
Text Solution
|
- The given graph shows the effect of substrate concentration on the rat...
Text Solution
|
- The given graph shows the effect of substrate concentration on the ra...
Text Solution
|
- Enzymes get denatured (killed) due to
Text Solution
|
- The given graph shows the effect of substrate concentration on the rat...
Text Solution
|
- Prepare a graph showing the action of temperature on enzyme activity
Text Solution
|
- The given graph is showing the relationship between the rate of enzyme...
Text Solution
|