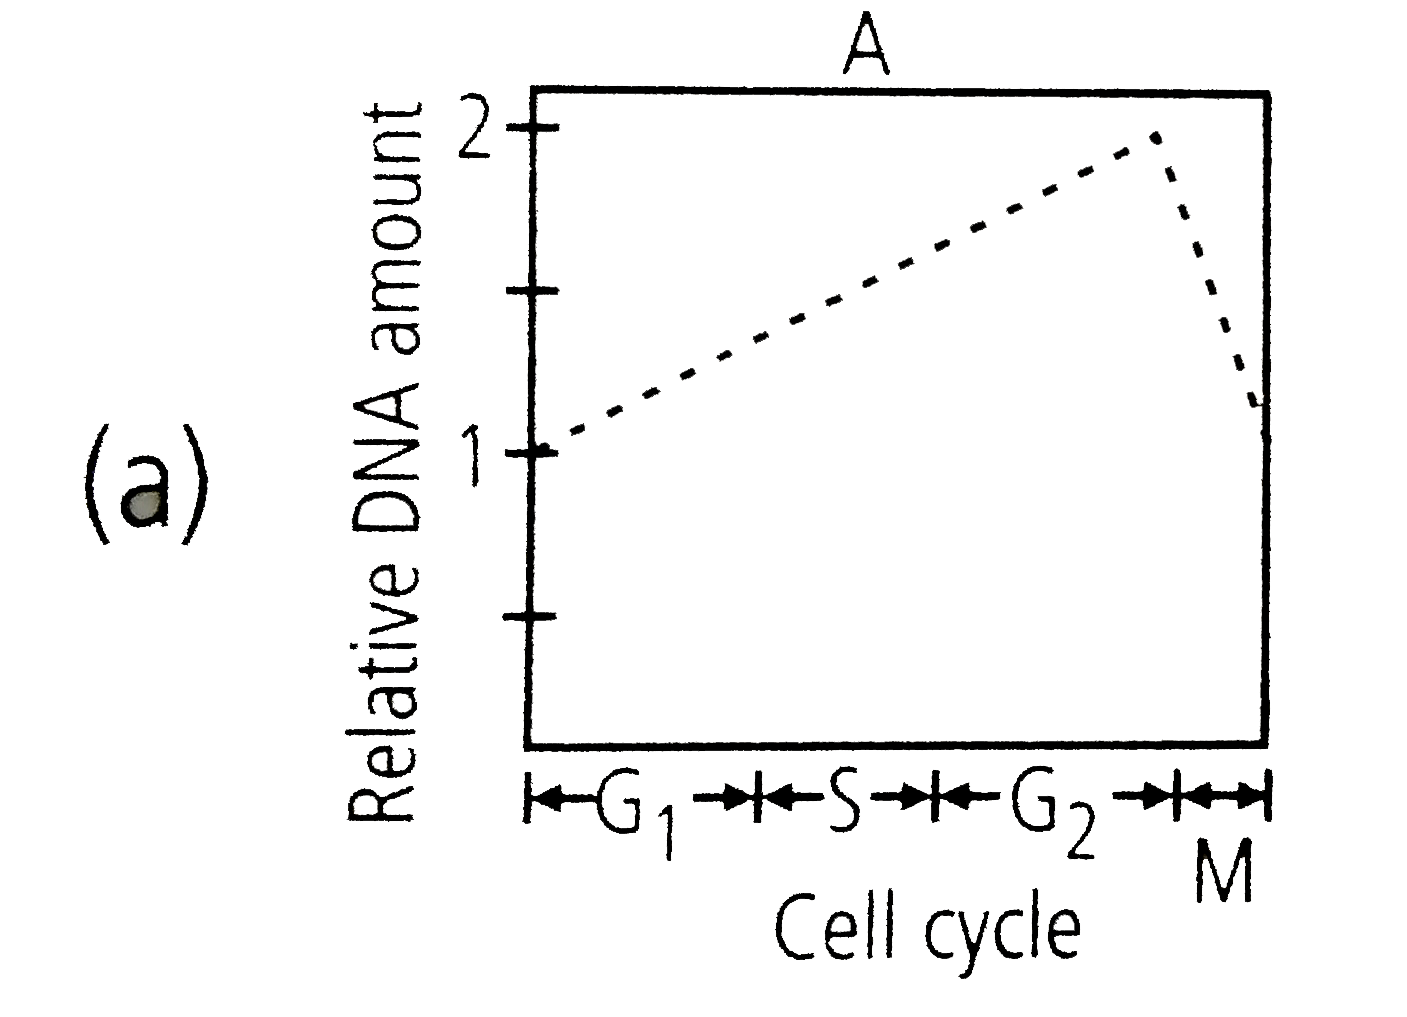
A
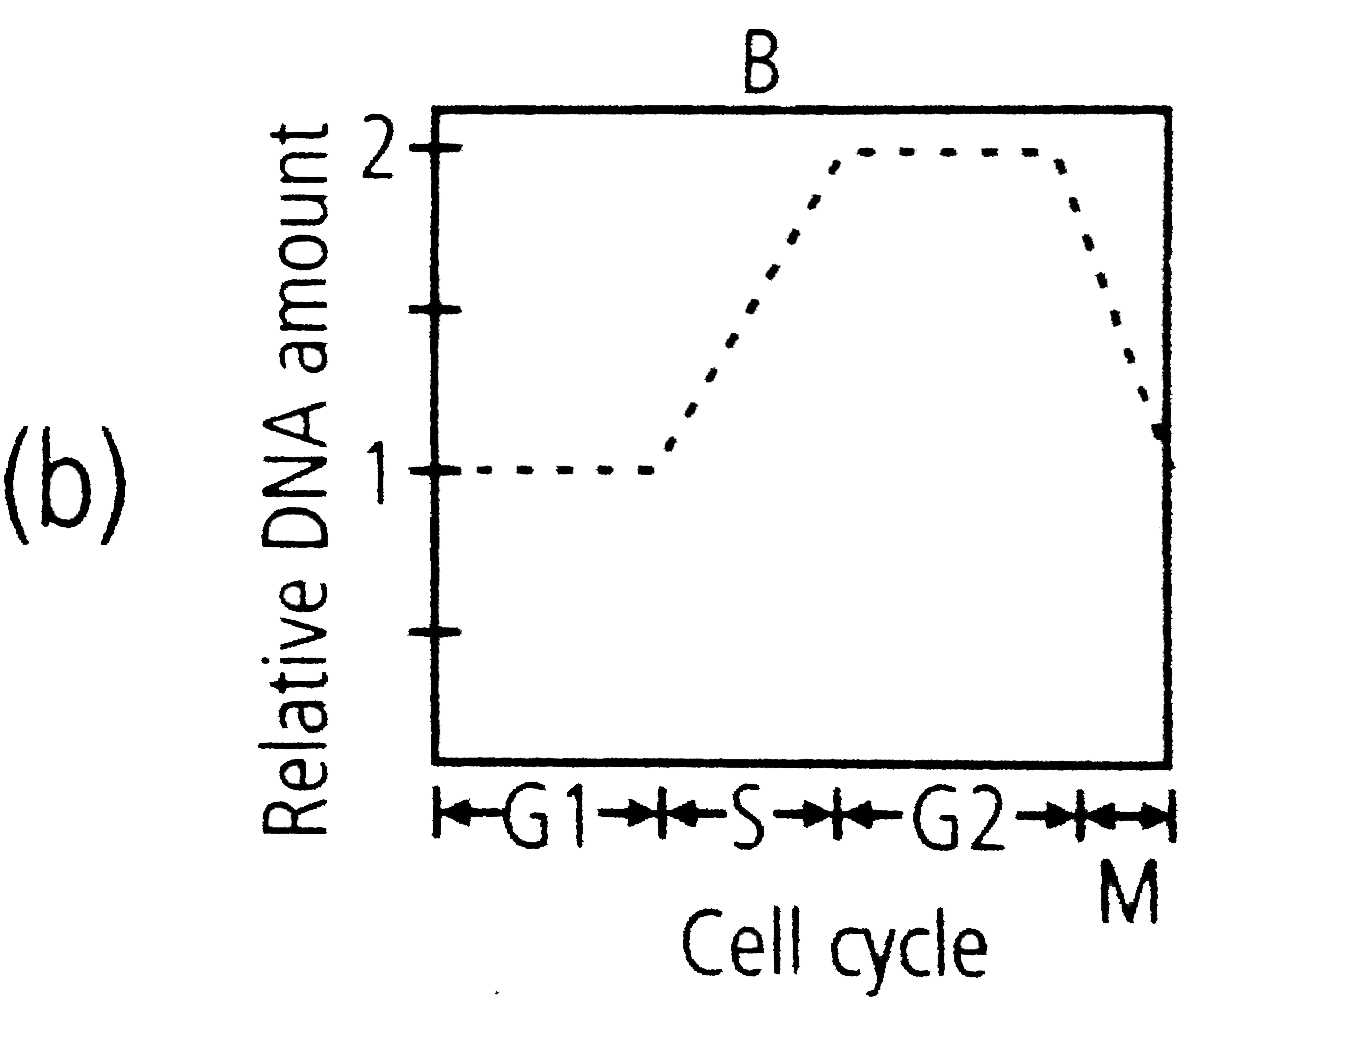
B
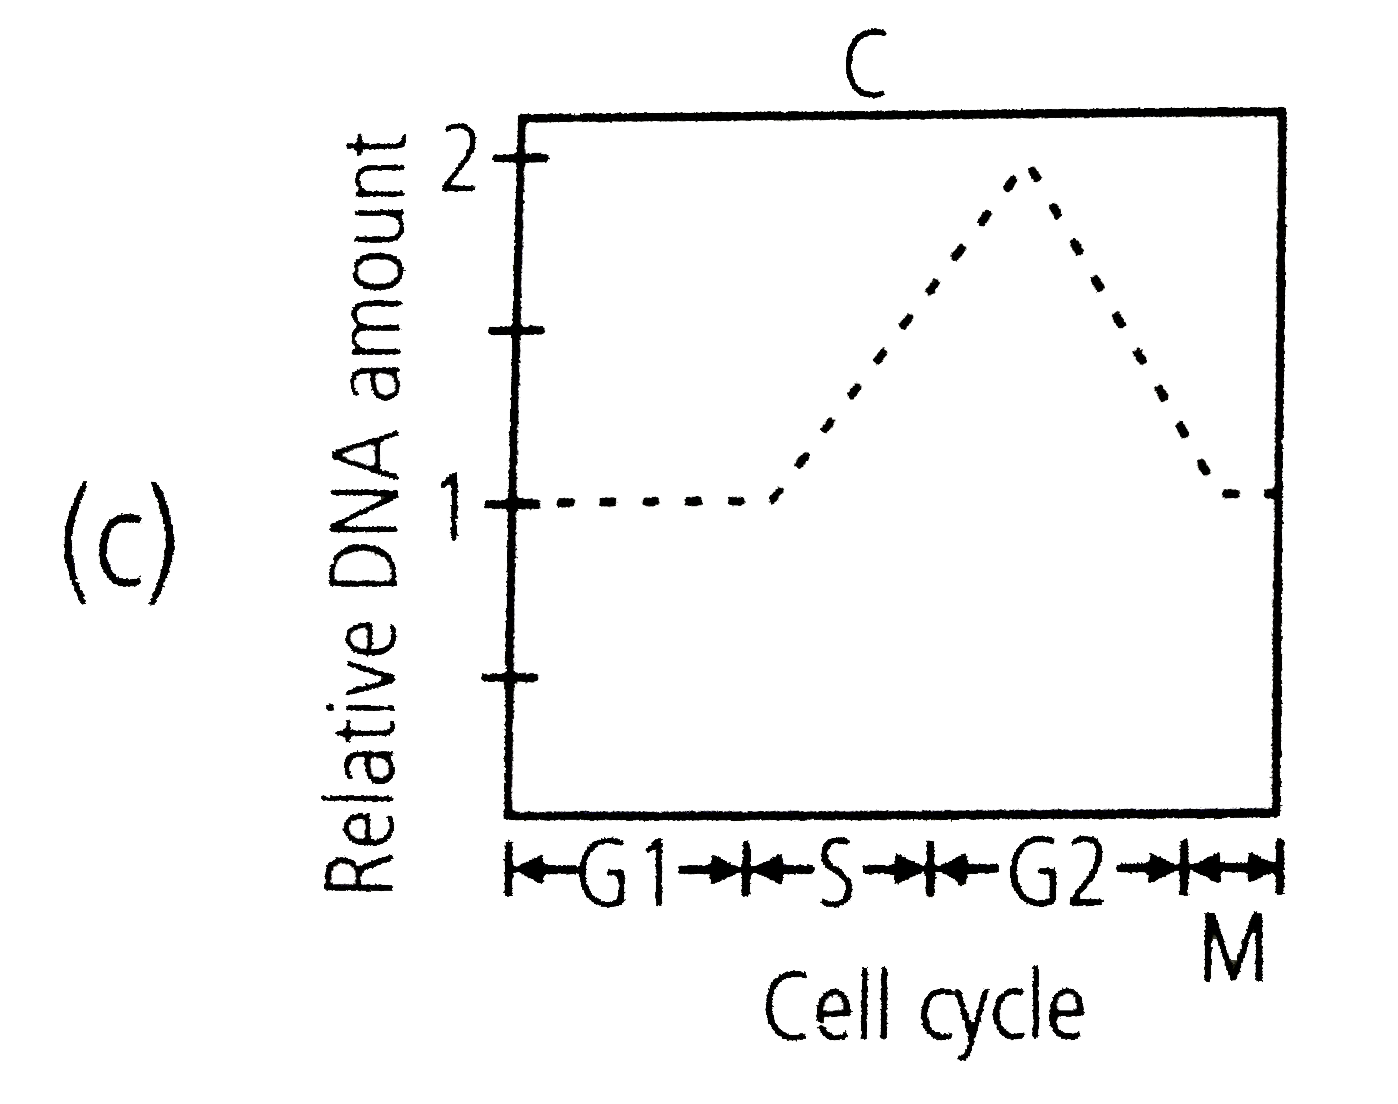
C
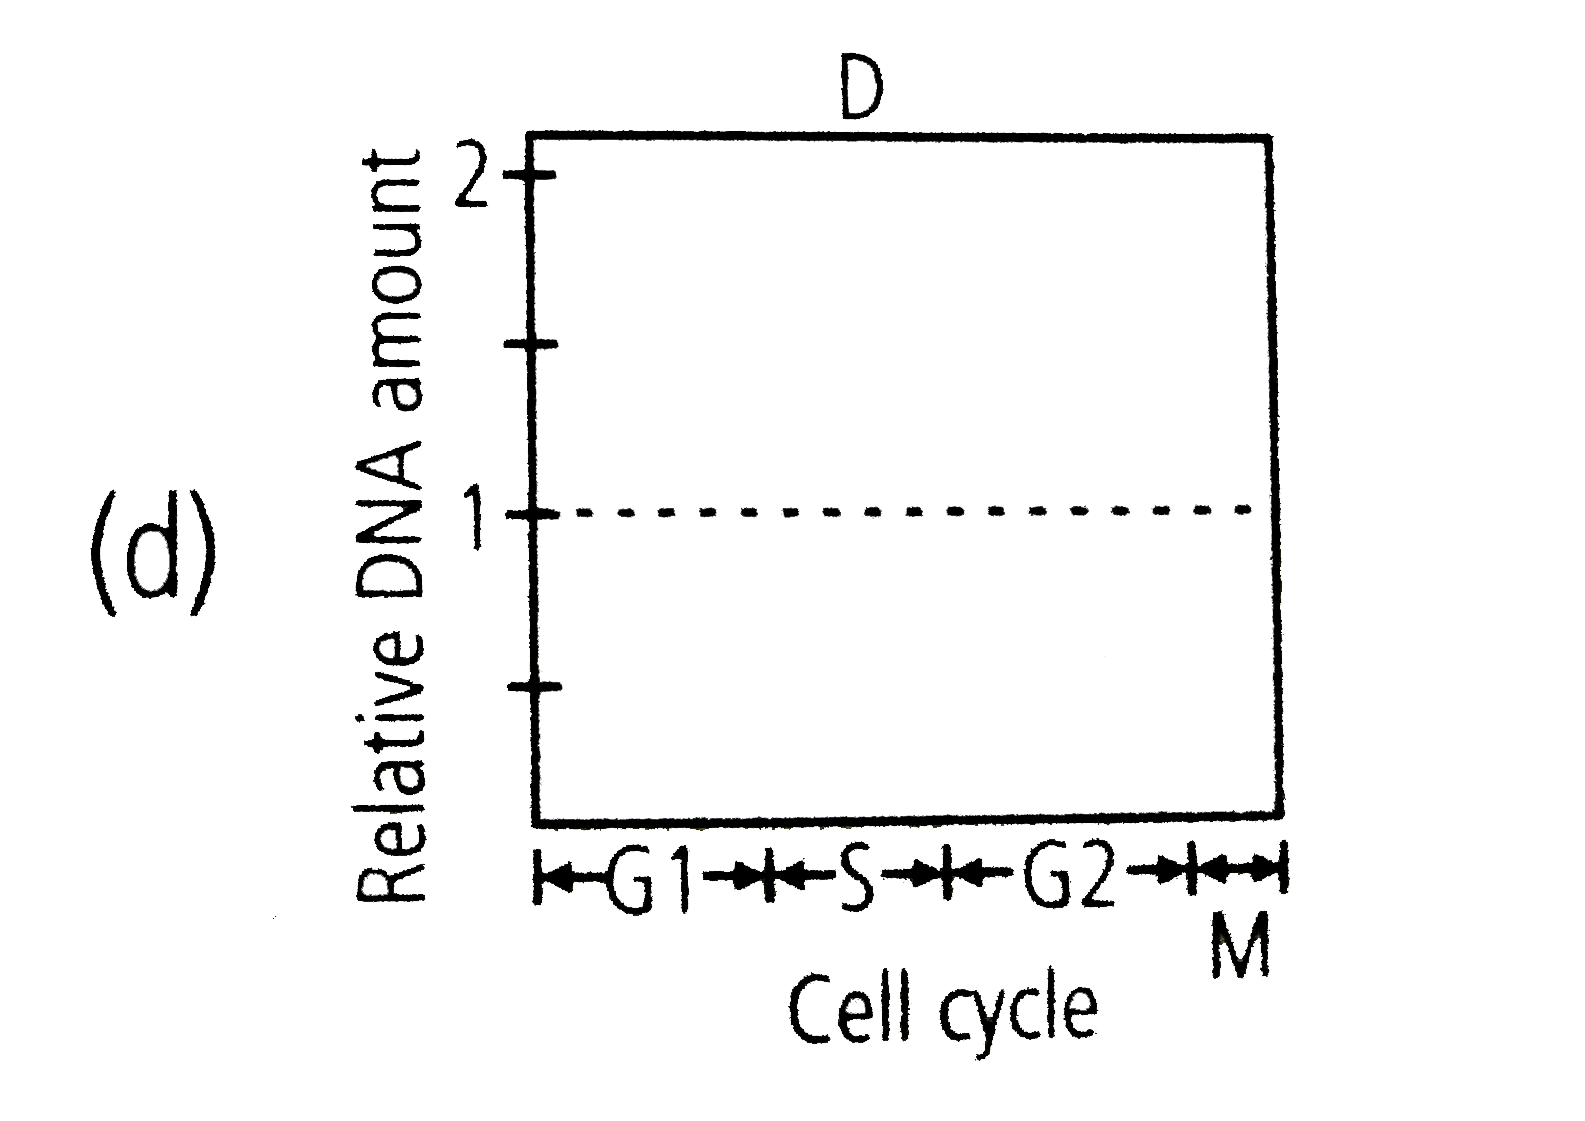
D
Text Solution
Verified by Experts
The correct Answer is:


Similar Questions
Explore conceptually related problems
Recommended Questions
- Which of the following graphs shows the relative change in the amount ...
Text Solution
|
- Mitochondrial DNA is :-
Text Solution
|
- Which is absent in Mitochondrial DNA ?
Text Solution
|
- Haploid cells undergo mitosis in
Text Solution
|
- दिये गये ग्राफ में विस्थापन के सापेक्ष वेग के परिवर्तन को दिखाया गया ह...
Text Solution
|
- निम्न में से कौन सा आरेख समसूत्री विभाजन करती हुई कोशिका के माइटोकॉन्ड...
Text Solution
|
- What type of DNA polymerase helps mitochondrial DNA replication in euk...
Text Solution
|
- A cell having 2n = 20, chromosomes with 2C amount of DNA, is undergoin...
Text Solution
|
- Which is absent in Mitochondrial DNA ?
Text Solution
|