To graphically represent the given pair of linear equations \(x = 4\) and \(y = 3\), we will follow these steps:
### Step 1: Understand the equations
The equations given are:
1. \(x = 4\)
2. \(y = 3\)
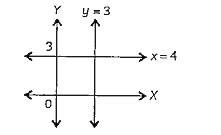
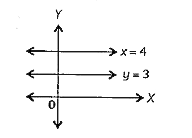
### Step 2: Graph the equation \(x = 4\)
The equation \(x = 4\) represents a vertical line where the x-coordinate is always 4, regardless of the value of y.
- To plot this line, we can choose several values for y:
- If \(y = 0\), then the point is \((4, 0)\)
- If \(y = 1\), then the point is \((4, 1)\)
- If \(y = 2\), then the point is \((4, 2)\)
- If \(y = -1\), then the point is \((4, -1)\)
Plot these points on the graph and draw a vertical line through them at \(x = 4\).
### Step 3: Graph the equation \(y = 3\)
The equation \(y = 3\) represents a horizontal line where the y-coordinate is always 3, regardless of the value of x.
- To plot this line, we can choose several values for x:
- If \(x = 0\), then the point is \((0, 3)\)
- If \(x = 1\), then the point is \((1, 3)\)
- If \(x = 2\), then the point is \((2, 3)\)
- If \(x = -1\), then the point is \((-1, 3)\)
Plot these points on the graph and draw a horizontal line through them at \(y = 3\).
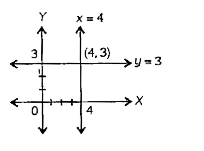
### Step 4: Identify the intersection point
The intersection point of the two lines \(x = 4\) and \(y = 3\) is where they meet. This point can be found by substituting the values:
- From \(x = 4\), we have \(x\) coordinate as 4.
- From \(y = 3\), we have \(y\) coordinate as 3.
Thus, the intersection point is \((4, 3)\).
### Step 5: Final graphical representation
Now, we can represent both lines on the same graph:
- Draw a vertical line at \(x = 4\).
- Draw a horizontal line at \(y = 3\).
- Mark the intersection point \((4, 3)\).