A
B
C
D
Text Solution
Verified by Experts
The correct Answer is:


Topper's Solved these Questions
Similar Questions
Explore conceptually related problems
ARIHANT PUBLICATION BIHAR-STATISTICS-EXAM BOOSTER (FOR CRACKING EXAM)
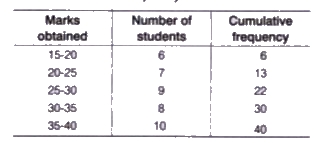
- The median of the frequency distribution is
Text Solution
|
- The most stable measure of central tendency is
Text Solution
|
- The measure which takes into account all the data items is
Text Solution
|
- Frequency polygon can be drawn after drawing
Text Solution
|
- Pie chart is drawn with the help of
Text Solution
|
- The total expenditure incurred by an industry under different heads is...
Text Solution
|
- The mid value of a class interval is 40. If the class size is 10, then...
Text Solution
|
- If the mean of five observations x,(x+1),(x+2)(x+5) and (x+7) is 11, t...
Text Solution
|
- The standard deviation for the data 7, 11, 15 is
Text Solution
|
- Consider the table given below The arithmetic mean of the marks ...
Text Solution
|
- The mean deviation of the following distribution is
Text Solution
|
- In a class of 40 students, 10 have failed and their average marks are ...
Text Solution
|
- If the mean of the following data is 13.5, then the value of p is
Text Solution
|
- The mean of the values of 1, 2, 3, ... x with respective frequencies y...
Text Solution
|
- A distribution consists of three components with frequencies 45, 40 an...
Text Solution
|
- The value of median from the following data is
Text Solution
|
- Read the following pie diagrams carefully and answer the questions tha...
Text Solution
|
- Read the following pie diagrams carefully and answer the questions tha...
Text Solution
|
- Read the following pie diagrams carefully and answer the questions tha...
Text Solution
|
- Read the following pie diagrams carefully and answer the questions tha...
Text Solution
|
- Read the following pie diagrams carefully and answer the questions tha...
Text Solution
|