A
B
C
D
Text Solution
Verified by Experts
The correct Answer is:


Similar Questions
Explore conceptually related problems
Recommended Questions
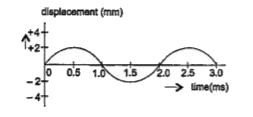
- The figure shows displacement time graph of a wave. The frequency of t...
Text Solution
|
- In a sinusoidal wave, the time required for a particular point to move...
Text Solution
|
- graphs of the same harmonic wave are shown below. The graph (1) on the...
Text Solution
|
- In a sinusoidal wave, the time required by a particular particle to mo...
Text Solution
|
- In a sinusoidal wave, the time required for a particular point to move...
Text Solution
|
- In a sinusoidal wave, the time required for a particular point to move...
Text Solution
|
- जय तरंगो में, किसी निश्चित बिंदु के लिये अधिकतम विस्थापन से शून्य विस्...
Text Solution
|
- In a sinusoidal wave, the time required for a particular point to move...
Text Solution
|
- In a sinusoidal wave,the time required for a particular point to move ...
Text Solution
|