Text Solution
Verified by Experts


Topper's Solved these Questions
Similar Questions
Explore conceptually related problems
SRS PUBLICATION-DATA HANDLING-QUESTION BANK
- Observe the adjacent bar graph and answer the following Which fru...
Text Solution
|
- Observe the adjacent bar graph and answer the following How many ...
Text Solution
|
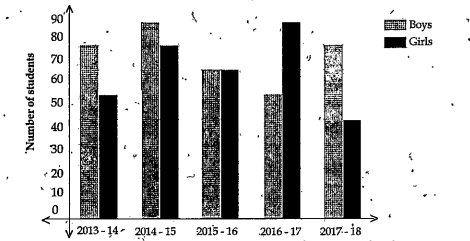
- In the adjacent double bar graph number of students of a class are sho...
Text Solution
|
- In the adjacent double bar graph number of students of a class are sho...
Text Solution
|
- In the adjacent double bar graph number of students of a class are sho...
Text Solution
|
- The adjoining pie chart gives the expenditure on various items during...
Text Solution
|
- The adjoining pie chart gives the expenditure on various items during...
Text Solution
|
- The following data show the number of students opting different subjec...
Text Solution
|
- Runs made by two batsman in 3 matches are given below Kohli: 49,98,7...
Text Solution
|
- Find mode of 38,42,35,37,45,50,32,43,43,40,36,38,43,38,and 47. verify ...
Text Solution
|
- The temperature in different places are 0,-5,7,10,13,-1,and 41 in deg...
Text Solution
|
- If the range of observation 7x,5x,3x,2x,x,(xgt0) is 12 . Then find val...
Text Solution
|
- Birth and death rates in different states in 2015 are given below. Dra...
Text Solution
|
- In the following alphabetical series what wiil be the next term in the...
Text Solution
|
- In the following alphabetical series what wiil be the next term in the...
Text Solution
|
- In the following alphabetical series what wiil be the next term in the...
Text Solution
|
- In the following alphabetical series.what will be the next term in the...
Text Solution
|
- In the following alphabetical series what wiil be the next term in the...
Text Solution
|
- In the following alphabetical series what wiil be the next term in the...
Text Solution
|
- In the following alphabetical series what will be the next term in the...
Text Solution
|