


SRS PUBLICATION-DATA HANDLING-QUESTION BANK
- Weight of food that term ate each day is given in the table (##SRPMA...
Text Solution
|
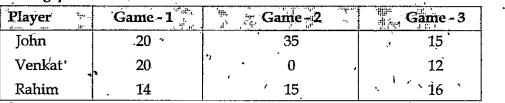
- The following table shows the scores of player in each game. Observe i...
Text Solution
|
- The following table shows the scores of player in each game. Observe i...
Text Solution
|
- Identify the one which is not affected by maximum and minimum value o...
Text Solution
|
- Find the difference between mean and median of the following data 3,16...
Text Solution
|
- Observe the table and answer the question based on the table
Text Solution
|
- Observe the table and answer the question based on the table
Text Solution
|
- Nani practices yoga regularly for a week as follows The average ...
Text Solution
|
- From this what can you conclude
Text Solution
|
- A data of 10 observations has a minimum value 15 and maximum value 25....
Text Solution
|
- From the graph what is the mode here ?
Text Solution
|
- The presentation of data can be
Text Solution
|
- Observe the graph and answer the question Find ratio between sale o...
Text Solution
|
- Observe the graph and answer the question HOW much sale over rice ...
Text Solution
|
- Observe the adjacent figure and answer the following questions Wha...
Text Solution
|
- Observe the adjacent figure and answer the following questions In ...
Text Solution
|
- The adjoining pie chart gives the expenditure on various Items during ...
Text Solution
|
- The adjoining pie chart gives the expenditure on various items during ...
Text Solution
|
- Collection of information in the form of numbers or words is called
Text Solution
|
- Collection of village population details from census register is type...
Text Solution
|