A
B
C
D
Text Solution
Verified by Experts


Similar Questions
Explore conceptually related problems
Recommended Questions
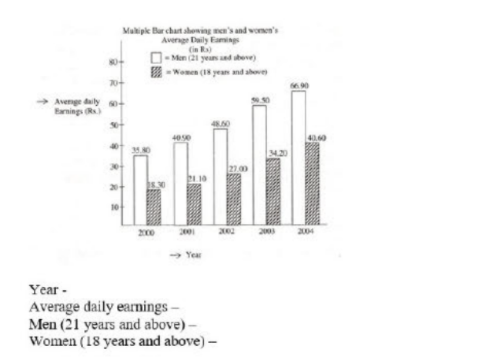
- The given chart shows men’s and women’s average daily earning in Compa...
Text Solution
|
- 'वैलेस का चार्ट' पर टिप्पणी कीजिए!
Text Solution
|
- प्राकृतिक चयन सिद्धांत का प्रतिपादन किया था-
Text Solution
|
- दिए गए परिपथ में धारा I का मान ज्ञात कीजिये ?
Text Solution
|
- दिए गये विघुत परिपथ में तथा के मध्य विभवान्तर की गणना कीजिए ।
Text Solution
|
- एक इलेक्ट्रॉन ( आवेश e ) + X - अक्ष की दिशा में v चाल से, समरूप चुम्...
Text Solution
|
- लेन्ज का नियम क्या है तथा यह किस राशि के संरक्षण पर आधारित है ?
Text Solution
|
- एक कुण्डली का क्षेत्रफल 100 सेमी^(2) है तथा उसमें 500 फेरे है | यदि कु...
Text Solution
|
- प्रत्यावर्ती परिपथ के लिए औसत शक्ति का व्यंजक प्राप्त कीजिए तथा...
Text Solution
|