A
B
C
D
Text Solution
Verified by Experts


Similar Questions
Explore conceptually related problems
Recommended Questions
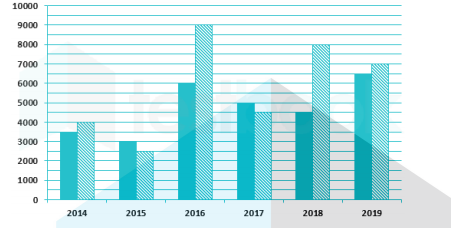
- Directions: Refer to the following graph and answer the given question...
Text Solution
|
- Match the following Column A to Column B
Text Solution
|
- The inequation represented by the graph given below is : <img src="htt...
Text Solution
|
- The inequation that best describes the graph given below is <img src=...
Text Solution
|
- The inequation that best describes the following graph is <img src="h...
Text Solution
|
- What is the ratio of the total bnumber of N and L type products togeth...
Text Solution
|
- What is the ratio of total books sold by store P and R together to th...
Text Solution
|
- Number of Redmi cellular sold by store R is what percent more than the...
Text Solution
|
- What is the respective ratio of total number of N and L type products ...
Text Solution
|