A
B
C
D
Text Solution
Verified by Experts


Similar Questions
Explore conceptually related problems
Recommended Questions
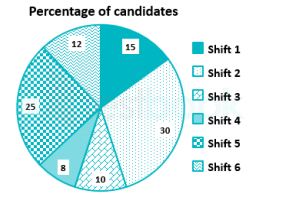
- Directions: Read the following Pie chart carefully and answer the foll...
Text Solution
|
- Determine the point of symmetry of a regular hexagon. <img src="htt...
Text Solution
|
- Match the following Column A to Column B
Text Solution
|
- Match the following Column A to Column B
Text Solution
|
- Match the following Column A to Column B
Text Solution
|
- The inequation represented by the graph given below is : <img src="htt...
Text Solution
|
- The inequation that best describes the graph given below is <img src=...
Text Solution
|
- The inequation that best describes the following graph is <img src="h...
Text Solution
|
- Shifting of the curve to right takes place in the case of ltimg src="h...
Text Solution
|