A
B
C
D
Text Solution
Verified by Experts


Similar Questions
Explore conceptually related problems
Recommended Questions
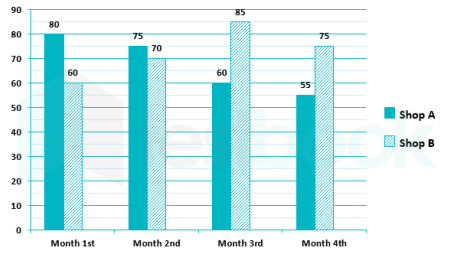
- Direction: The given bar graph shows the number of pens sold by two sh...
Text Solution
|
- Match the following Column A to Column B
Text Solution
|
- The inequation represented by the graph given below is : <img src="htt...
Text Solution
|
- The inequation that best describes the graph given below is <img src=...
Text Solution
|
- The inequation that best describes the following graph is <img src="h...
Text Solution
|
- एक महीने में, किसी दुकान से बेचे गए घरेलू उपकरणों की संख्या निम्न प्रक...
Text Solution
|
- निम्न दण्ड आरेख एक विक्रेता द्वारा वर्ष के विभिन्न माहों में बेची गई प...
Text Solution
|
- निम्न दण्ड आरेख एक विक्रेता द्वारा वर्ष के विभिन्न माहों में बेची गई प...
Text Solution
|
- Bar graph given below shows pens sold by a retailor on five different ...
Text Solution
|