


Topper's Solved these Questions
DIKSHA QUESTIONS
OSWAL PUBLICATION|Exercise UNIT -VII: Statistics and Probability (Statistics) (Long Answer Type Questions)|4 VideosDIKSHA QUESTIONS
OSWAL PUBLICATION|Exercise UNIT -VII: Statistics and Probability (Probability) (MULTIPLE CHOICE QUESTIONS)|6 VideosDIKSHA QUESTIONS
OSWAL PUBLICATION|Exercise UNIT -VII: Statistics and Probability (Statistics) (VERY SHORT ANSWER TYPE QUESTIONS)|6 VideosCOORDINATE GEOMETRY
OSWAL PUBLICATION|Exercise SELF ASSESSMENT |20 VideosINTRODUCTION TO TRIGONOMETRY
OSWAL PUBLICATION|Exercise Self - Assessment |15 Videos
Similar Questions
Explore conceptually related problems
OSWAL PUBLICATION-DIKSHA QUESTIONS -UNIT -VII: Statistics and Probability (Statistics) (Short Answer Type Questions )
- If the mean of the following distribution is 54 , find the missing fre...
Text Solution
|
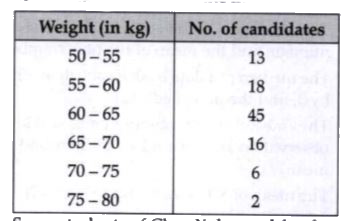
- The following table shows the distribution of weights of 100 candiates...
Text Solution
|
- Some students of Class X donated for the welfare of old age persons . ...
Text Solution
|
- The average score of boys in an examination of a school is 71 and tha...
Text Solution
|
- The following data gives the information on the observed lifetimes ...
Text Solution
|
- Determine the missing frequnecy x , from the following data , when Mod...
Text Solution
|
- Find the unknown values in the following table :
Text Solution
|
- The mode of a distribution is 55 and the modal class is 45-60 and the ...
Text Solution
|
- Find the mean of 30 numbers given mean of ten of them is 12 and the me...
Text Solution
|
- The mean of 5 numbers is 10 . If 3 decrease each number , find the mea...
Text Solution
|
- The median of a data is 20 . If each item is increased by 2 , find the...
Text Solution
|
- The mean of 20 observations is 12 . If each observation is increased b...
Text Solution
|
- The mean of 6, 6+2x , 5 and 8 and 8+3x is 20 . Find the value of x .
Text Solution
|
- Find the Mode of the following data : Also if the Median of the d...
Text Solution
|