Text Solution
Verified by Experts


Similar Questions
Explore conceptually related problems
Recommended Questions
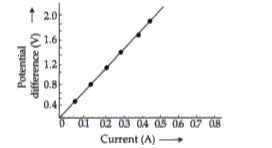
- A V-I graph for a nichrome wire is given below. What do you infer from...
Text Solution
|
- From the given v - t graph (Figure), it can be inferred that the objec...
Text Solution
|
- Draw velocity-time graph of a unitorm motion of an object along a stra...
Text Solution
|
- From the given v-t graph (see figure), it can be inferred that the obj...
Text Solution
|
- नाभिक की बंधन ऊर्जा से आप क्या समझते हैं? नाभिकों की प्रति न्यूक्लिऑन...
Text Solution
|
- ताप के फलन के रूप में निक्रोम की प्रतिरोधकता हेतु ग्राफ खींचिए।
Text Solution
|
- Draw a V- I graph.
Text Solution
|
- Draw a graph of resistivity of nichrome as a function of absolute temp...
Text Solution
|
- What do you understand by forced vibration ? Draw a graph to show how ...
Text Solution
|