Text Solution
Verified by Experts
The correct Answer is:


Similar Questions
Explore conceptually related problems
Recommended Questions
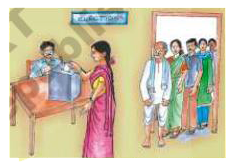
- In a election 60% of voters cast their votes. Form an equation and dra...
Text Solution
|
- The inequation represented by the graph given below is : <img src="htt...
Text Solution
|
- The inequation that best describes the graph given below is <img src=...
Text Solution
|
- The inequation that best describes the following graph is <img src="h...
Text Solution
|
- The percentage of eligible voters who cast their votes in an election ...
Text Solution
|
- In an election, out of 60,000 eligible voters 42000 cast their vote. C...
Text Solution
|
- 8% of the voters in an election did not cast their votes. In this elec...
Text Solution
|
- In a election 60% of voters cast their votes. Form an equation and dra...
Text Solution
|
- In a election 60% of voters cast their votes. Form an equation and dra...
Text Solution
|