


Topper's Solved these Questions
Similar Questions
Explore conceptually related problems
NCERT TELUGU-STATISTICS-EXERCISE-9.2
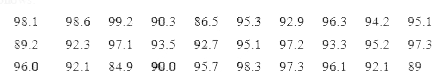
- The relative humidity (in %) of a certain City for a September month o...
Text Solution
|
- Weights of parcels in a transport office are given below. Find th...
Text Solution
|
- Number of families in a village in correspondence with the number of c...
Text Solution
|
- If the mean of the following frequency distribution is 7.2 find value ...
Text Solution
|
- Number of villages with respect to their population as per India censu...
Text Solution
|
- AFLATOUN social and financial educational program intiated savings pro...
Text Solution
|
- The heights of boys and girls of IX class of a school are given below....
Text Solution
|
- Centuries scored and number of cricketers in the world are given below...
Text Solution
|
- On the occasion of New year’s day a sweet stall prepared sweet packets...
Text Solution
|
- The mean (average) weight of three students is 40 kg. One of the stude...
Text Solution
|
- The donations given to an orphanage home by the students of different ...
Text Solution
|
- There are four unknown numbers. The mean of the first two numbers is 4...
Text Solution
|