A
B
C
D
Text Solution
Verified by Experts
The correct Answer is:


Similar Questions
Explore conceptually related problems
Recommended Questions
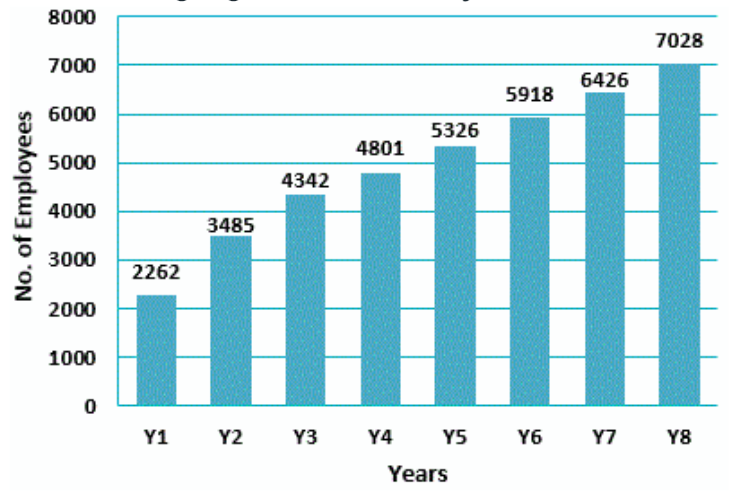
- The Bar graph shown below presents the number of employess in an offic...
Text Solution
|
- Calculate the cost of living index for the year 2006 taking 1990 as th...
Text Solution
|
- Calculate the cost of living index for the year 2002, taking 1994 as t...
Text Solution
|
- From the following data, using weighted average method, calculate the ...
Text Solution
|
- How many lines of symmetry does the above figure have ? <img src="http...
Text Solution
|
- Determine the point of symmetry of a regular hexagon. <img src="htt...
Text Solution
|
- Match the following Column A to Column B
Text Solution
|
- Match the following Column A to Column B
Text Solution
|
- Match the following Column A to Column B
Text Solution
|