A
B
C
D
Text Solution
Verified by Experts
The correct Answer is:


Similar Questions
Explore conceptually related problems
Recommended Questions
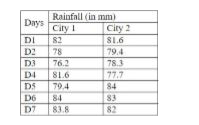
- The Table given below presents the Rainfall (in mm) in two cities on d...
Text Solution
|
- Match the following Column A to Column B
Text Solution
|
- The inequation represented by the graph given below is : <img src="htt...
Text Solution
|
- The inequation that best describes the graph given below is <img src=...
Text Solution
|
- Rainfall (in mm) recorded in 50 cities in a partial region on a part...
Text Solution
|
- The rainfall recorded in a city for 60 days is given in the following ...
Text Solution
|
- ਇੱਕ ਸ਼ਹਿਰ ਵਿਚ ਕਿਸੇ ਖਾਸ ਹਫ਼ਤੇ ਦੇ 7 ਦਿਨਾਂ ਵਿਚ ਹੋਈ ਵਰਖਾ (ਮਿ. ਮੀ. ਵਿਚ) ਹੇਠ ਲ...
Text Solution
|
- एक नगर में किसी विशेष सप्ताह के 7 दिनों में हुई वर्षा (mm में ) निम्न...
Text Solution
|
- एक नगर में किसी विशेष सप्ताह के 7 दिनों में हुई वर्षा (mm में ) निम्न...
Text Solution
|