A
B
C
D
Text Solution
Verified by Experts
The correct Answer is:


Similar Questions
Explore conceptually related problems
Recommended Questions
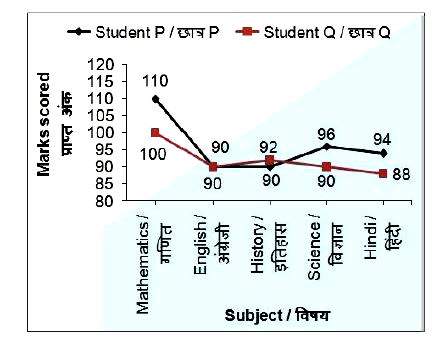
- The line chart given below shows the marks scored by 2 students P and ...
Text Solution
|
- Name the enzymes 'P' and 'Q' that are involved in the processes given ...
Text Solution
|
- How many lines of symmetry does the above figure have ? <img src="http...
Text Solution
|
- Match the following Column A to Column B
Text Solution
|
- The inequation represented by the graph given below is : <img src="htt...
Text Solution
|
- The inequation that best describes the graph given below is <img src=...
Text Solution
|
- दिए गए चित्र में पाँच विद्यालयों में वर्ग 9 की परीक्षा में 80% से अधिक...
Text Solution
|
- नीचे दिए गए आयत चित्र में 80 छात्रों के प्राप्तांकों को दर्शाया गया है...
Text Solution
|
- In Figure, the pie-chart shows the marks obtained by a student in v...
Text Solution
|