A
B
C
D
Text Solution
Verified by Experts
The correct Answer is:


Similar Questions
Explore conceptually related problems
Recommended Questions
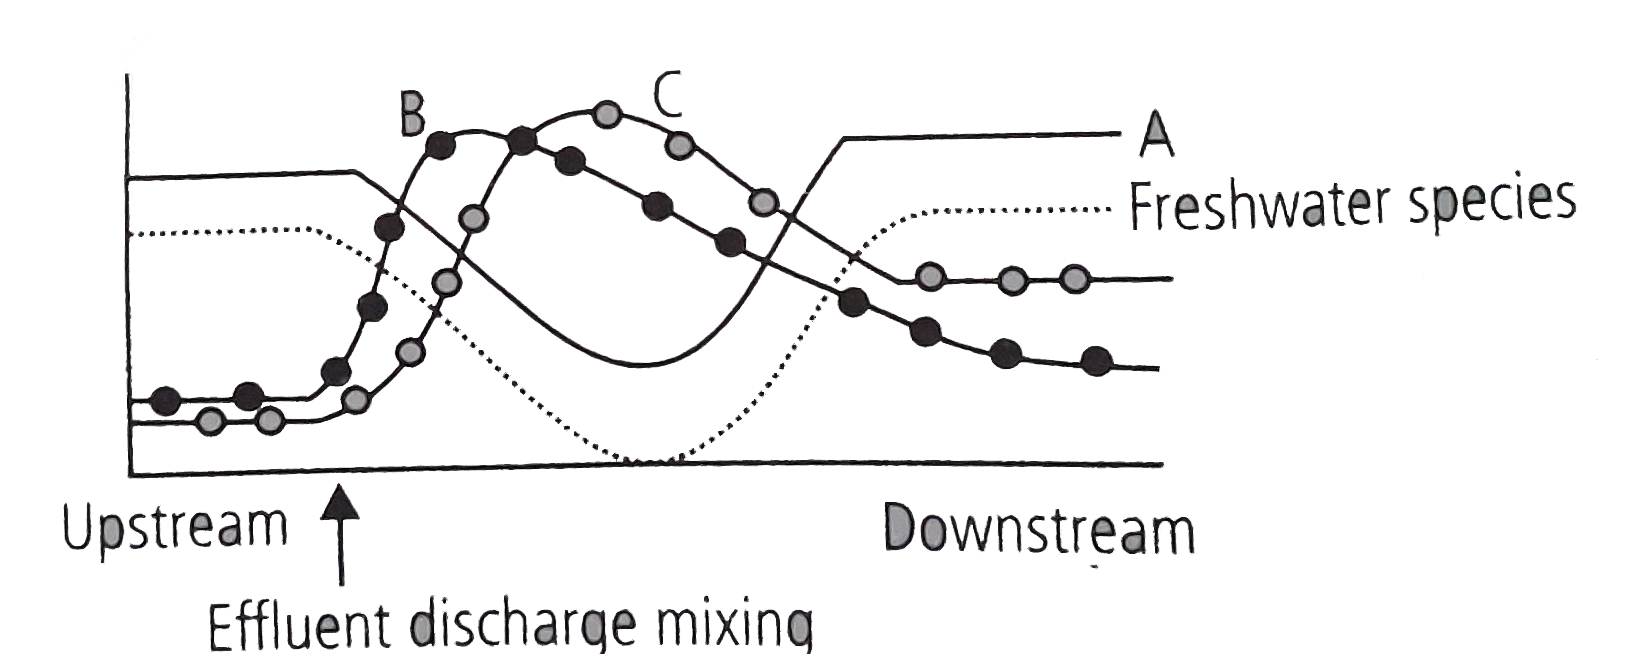
- The graph given below represents changes in different ecological param...
Text Solution
|
- Given graph is drawn on the parameters of growth versus time. Here A,B...
Text Solution
|
- Given below is a graph on the parametes of growth versus time A,B , C ...
Text Solution
|
- Graph for one mole gas is given below Process, A rarr B represent...
Text Solution
|
- Given below is one of the types of ecological pyramids. This type repr...
Text Solution
|
- Which kind of ecological pyramid is represented by the figure given be...
Text Solution
|
- Which kind of ecological pyramid is represented by the figure given be...
Text Solution
|
- Given below is one of the types of ecological pyramids. This type repr...
Text Solution
|
- Given below is one of the types of ecological pyramids. This ty...
Text Solution
|