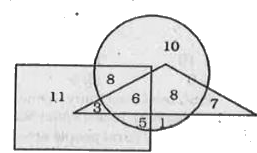
Home
Class 14
REASONING
In the above diagram, the rectangle repr...


In the above diagram, the rectangle represents males, the circle represents actors and the triangle singers. Which numbered area represents male singers ?

A

8

B

6

C

5

D

3

Text Solution

Verified by Experts

The correct Answer is:
D

The number .3. is common to rectangle and triangle only.
Promotional Banner

Topper's Solved these Questions

  • LOGICAL VENN - DIAGRAM

    KIRAN PUBLICATION|Exercise TYPE- II|159 Videos
  • FINDING THE MISSING NUMBER

    KIRAN PUBLICATION|Exercise TYPE - II|380 Videos
  • MIRROR & WATER IMAGES

    KIRAN PUBLICATION|Exercise TYPE -II|9 Videos

Similar Questions

Explore conceptually related problems

In the following diagram, the triangle represents doctors, the circle represents players and the rectangle represents singers. Which region represents doctors who are singers but not players?

In the following figure, the triangle represents teachers, the circle represents students and the rectangle represents actors. Which number represents teachers who are also students and actors?

Which one represents male gametc

In the following diagram, the triangle represents 'actors', the circle represents 'male', the rectangle represents "painters 3 and the square represents "artists. The numbers in different segments show the number of persons. How many male actors are painters but not artists?

In the following diagram, the triangle represents ‘actors’, the circle represents ‘male’, the rectangle represents ‘painters’ and the square represents ‘artists’. The numbers in different segments show the number of persons. निम्नलिखित आरेख में, त्रिभुज अभिनेताओं , वृत्त पुरुषों का,आयत चित्रकारों का, वर्ग कलाकारों का प्रतिनिधित्व करता है। विभिन्न खंडों में संख्या व्यक्तियों की संख्या को दर्शाती है। How many male actors are painters but not artists? कितने पुरुष अभिनेता चित्रकार हैं लेकिन कलाकार नहीं है?

In the following diagram, the triangle represents 'rich', the circle represents Farmer and the rectangle represents ‘rural'. The numbers in different segments show the number of persons. How many rich Farmers are not rural?

KIRAN PUBLICATION-LOGICAL VENN - DIAGRAM-TYPE- II
  1. How many players are neither teacher nor singers?

    Text Solution

    |

  2. Find out the number of students who play only cricket.

    Text Solution

    |

  3. In the above diagram, the rectangle represents males, the circle repre...

    Text Solution

    |

  4. Triangle represents people in the first age group i.e. 40-50 years, Sq...

    Text Solution

    |

  5. How many educated people are employed ?

    Text Solution

    |

  6. Find the urbon , corrupt employess in the following diagram :

    Text Solution

    |

  7. An interview of 60 persons to know whether they play Tennis, Chess ...

    Text Solution

    |

  8. In the given diagram , circle represents athletes , square represents ...

    Text Solution

    |

  9. In the the following diagram, reactangle represents people who rea...

    Text Solution

    |

  10. In the following figure, how many educated people are employed ?

    Text Solution

    |

  11. In the following diagram, police officer represents circle. corrupt ...

    Text Solution

    |

  12. Which number is in the triangle square and circle ?

    Text Solution

    |

  13. In the give diagram, Circle represents professional, Square represents...

    Text Solution

    |

  14. In the given diagram, Circle represents professionals, Square represen...

    Text Solution

    |

  15. In the given diagram, Circle rep- resents strong men, Square represent...

    Text Solution

    |

  16. In the given figure, Circle represents persons having Car, triangle re...

    Text Solution

    |

  17. In the following questions, study the following diagram carefully and ...

    Text Solution

    |

  18. In the following questions, study the following diagram carefully and ...

    Text Solution

    |

  19. In the following figure represents hardworking. triangle represents s...

    Text Solution

    |

  20. The above diagram shows the survey on a sample of 1000 persons ...

    Text Solution

    |