A
B
C
D
Text Solution
Verified by Experts
The correct Answer is:


Similar Questions
Explore conceptually related problems
Recommended Questions
- A plot of volume (V)versus temperature (T) for agas at constant pressu...
Text Solution
|
- In the following sketch three constant pressure lines are plotted on T...
Text Solution
|
- Pressure versus temperature graph of an ideal gas of equal number of m...
Text Solution
|
- The plot of volume versus pressure at constant temperature is a…………………...
Text Solution
|
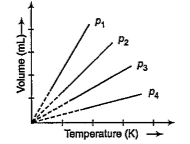
- Which of the following volume (V)-temperature (T) plots represents the...
Text Solution
|
- Which of the following volume (V) - temperature (T) plots represents t...
Text Solution
|
- Which of the following volume (V)-temperature (T) plots represents the...
Text Solution
|
- At a given pressure, the volume of a given amount of gas at 0^(@)C is ...
Text Solution
|
- The plot of pressure (P) versus temperature (T) for an ideal gas will ...
Text Solution
|