A
B
C
D
Text Solution
Verified by Experts
The correct Answer is:


Topper's Solved these Questions
DATA HANDLING
BHARDWAJ ACADEMY|Exercise CHAPTER EXERCISE (PREVIOUS YEARS QUESTIONS) |10 VideosDATA HANDLING
BHARDWAJ ACADEMY|Exercise CHAPTER EXERCISE (PREVIOUS YEARS QUESTIONS) |10 VideosALGEBRA
BHARDWAJ ACADEMY|Exercise CHAPTER EXERCISE (Previous Years. Questions)|24 VideosERROR ANALYSIS
BHARDWAJ ACADEMY|Exercise CHAPTER EXERCISE (Previous Year Questions)|19 Videos
BHARDWAJ ACADEMY-DATA HANDLING-CHAPTER EXERCISE
- How many girls have a height of 145 cm and more?
Text Solution
|
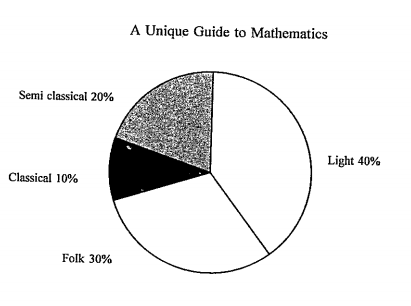
- A survey was made to find the type of music that a certain group of yo...
Text Solution
|
- A survey was made to find the type of music that a certain group of yo...
Text Solution
|
- A survey was made to find the type of music that a certain group of...
Text Solution
|
- The marks (out of 100) obtained by a group of students in a science te...
Text Solution
|
- The marks (out of 100) obtained by a group of students in a science te...
Text Solution
|
- The marks (out of 100) obtained by a group of students in a science te...
Text Solution
|
- The enrolment in a school during six consecutive years was as follo...
Text Solution
|
- The rainfall (in mm) in a city on 7 days of a certain week was recorde...
Text Solution
|
- The rainfall (in mm) in a city on 7 days of a certain week was reco...
Text Solution
|
- The rainfall (in mm) in a city on 7 days of a certain week was reco...
Text Solution
|
- For which of these would you use a histogram to show the data?
Text Solution
|
- The temperature of a particular place is continuously decreasing. Whic...
Text Solution
|
- The median and mean values of the marks obtained by the students of a ...
Text Solution
|
- If the mean and median are 25 and 28 respectively, then find the value...
Text Solution
|
- If the mean of five observations x,x+3,x+6,x+9 and x+12 is 15, then fi...
Text Solution
|
- Mean of median, mode and range of the data 1, 2, 3, 3, 2, 5, 6, 2, 2...
Text Solution
|
- The year, in which the percentage increase in export was maximum from ...
Text Solution
|
- What was the percentage drop in export quantity from 2005 to 2006?
Text Solution
|
- The total number of examinees was
Text Solution
|