A
B
C
D
Text Solution
Verified by Experts
The correct Answer is:


BHARDWAJ ACADEMY-DATA HANDLING-CHAPTER EXERCISE (PREVIOUS YEARS QUESTIONS)
- The mean of the median, mode and range of the observations 6, 6, 9, 14...
Text Solution
|
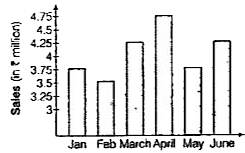
- According to the given graph, between which two consecutive months was...
Text Solution
|
- Given n numbers, ngt1, of which,one is 1-(1)/(n) and all others are 1'...
Text Solution
|
- Sum of mean and median of the numbers 5.02, 5.18, 5.12, 5.007 and 5.01...
Text Solution
|
- The mean of 10 numbers is 0. If 72 and -12 are included in these numbe...
Text Solution
|
- The mean of median and mode of the data 7, 6, 7, 9, 8, 8, 10, 8 is
Text Solution
|
- The mean of range, mode and median of the data 4, 3, 2, 2, 7, 2, 2, 0,...
Text Solution
|
- The sum of mean, mode and median of the data 6, 3, 9, 5, 1, 2, 3, 6, 5...
Text Solution
|
- If the mean of five observation x , x+2, x+4x+6, x+8 is 11, find the m...
Text Solution
|
- The mean of mode, median and range of the data 2, 1, 2, 3, 3, 6, 4, ...
Text Solution
|