A
B
C
D
Text Solution
Verified by Experts
The correct Answer is:


Similar Questions
Explore conceptually related problems
Recommended Questions
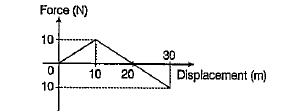
- Figure shows the variation of force and displacement. The value of wor...
Text Solution
|
- Assertion , No work is done if the displacement is zero Reason: Work...
Text Solution
|
- Adjacent figure shows the force-displacement graph of a moving body, t...
Text Solution
|
- 5 न्यूटन का एक बल वस्तु को 10 मीटर विस्थपित करता है। यदि बल द्वारा कृत...
Text Solution
|
- A box is pulled with a force of 25 N to produce a displacement of 15 m...
Text Solution
|
- किसी वस्तु पर 5 N का बल लगता है तथा विस्थापन 8 मीटर है | किया गया कार्...
Text Solution
|
- A box is pulled with a force of 25 N to produce a displacement of 15 m...
Text Solution
|
- A box is pulled with a force of 25 N to produce a displacement of 15 m...
Text Solution
|
- अभिकथनः विस्थापन के शून्य होने पर कोई भी कार्य नहीं किया जाता है। तर...
Text Solution
|