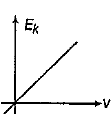
A
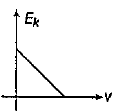
B
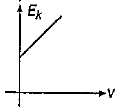
C
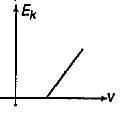
D
Text Solution
Verified by Experts
The correct Answer is:


Similar Questions
Explore conceptually related problems
Recommended Questions
- Which one of the following graphs represents the variation of maximum ...
Text Solution
|
- The maximum kinetic energy of electrons emited in the photoelectric ef...
Text Solution
|
- Which one of the following graphs represents the variation of maximum ...
Text Solution
|
- Do all electrons emitted in the photoelectric effect have the same kin...
Text Solution
|
- प्रकाशवैधुत प्रभाव में आपतित प्रकाश की आवृत्ति और उत्सर्जित इलेक्...
Text Solution
|
- Which one of the following graphs represent the variation of kinetic e...
Text Solution
|
- Which one of the following graphs represent the variation of kinetic e...
Text Solution
|
- For photoelectric effect, the graph of the maximum kinetic energy K of...
Text Solution
|
- Which one of the following graphs represents the variation of maximum ...
Text Solution
|