A
B
C
D
Text Solution
Verified by Experts
The correct Answer is:


Similar Questions
Explore conceptually related problems
Recommended Questions
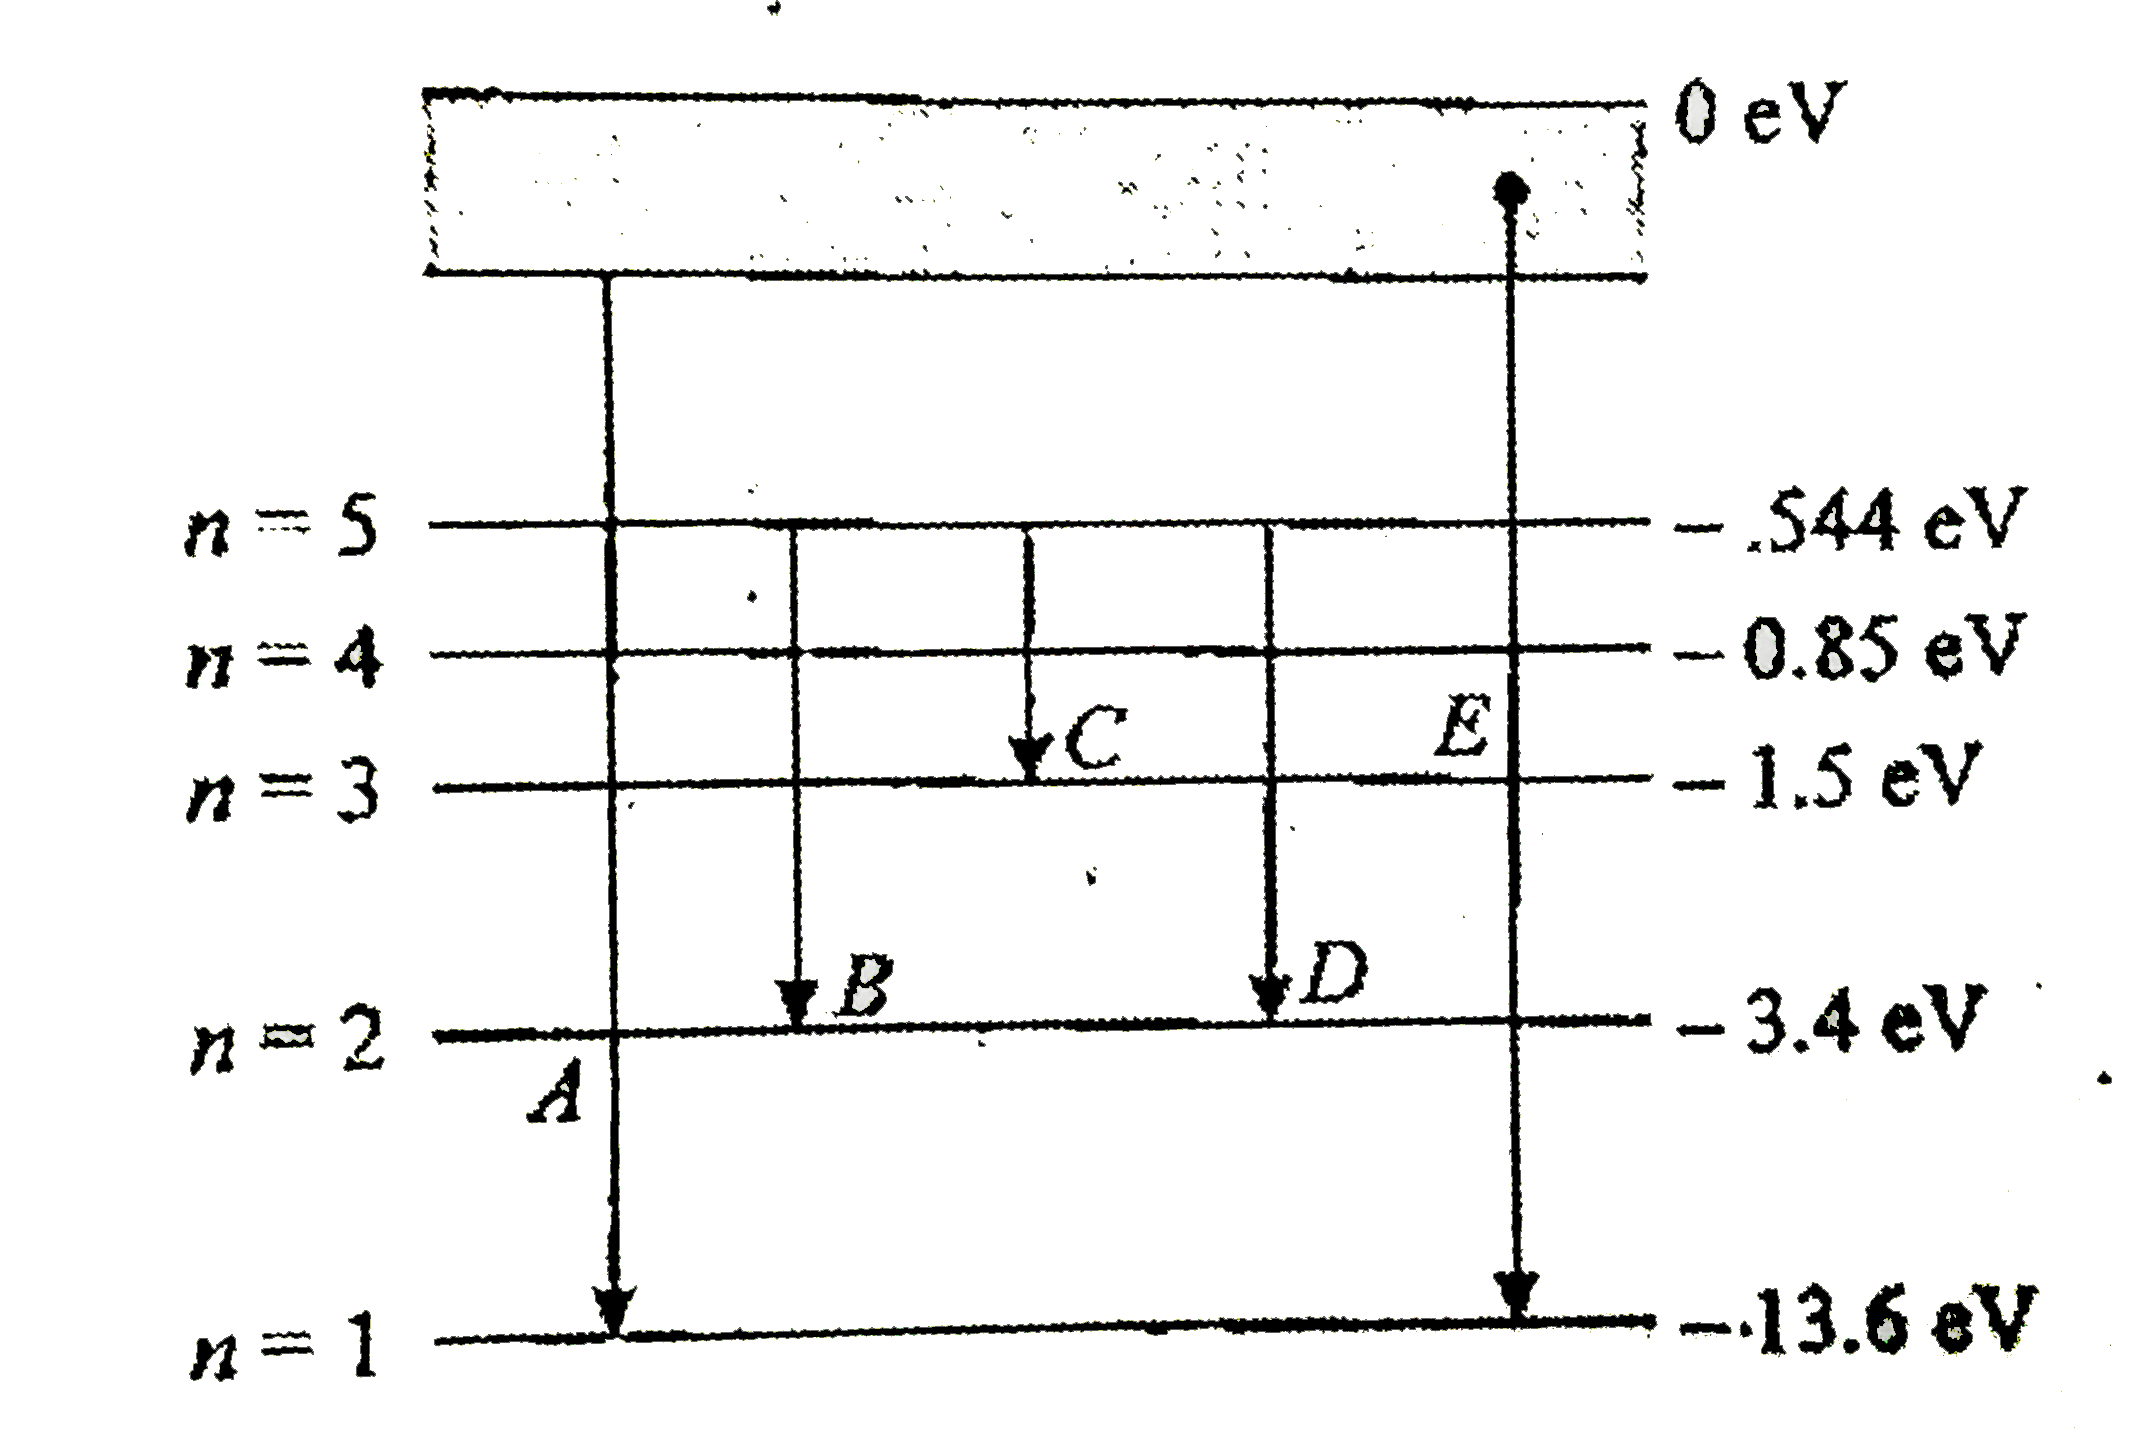
- In the following figure the energy levels of hydroge atom have been sh...
Text Solution
|
- The energy levels of the hydrogen spectrum is shown in figure. There a...
Text Solution
|
- A gas of identical H-like atom has some atoms in the lowest (ground) ...
Text Solution
|
- In the following figure the energy levels of hydroge atom have been sh...
Text Solution
|
- Energy levels A,B,C of a certain atoms corresponding to increasing val...
Text Solution
|
- हाइड्रोजन परमाणु के ऊर्जा स्थरों को चित्र में प्रदर्शित किया गया है ...
Text Solution
|
- For a certain atom, there are energy levels A, B, C corresponds to ene...
Text Solution
|
- एक परमाणु का ऊर्जा स्तर आरेख चित्र में दर्शाया गया है। संक्रमण B के स...
Text Solution
|
- किसी परमाणु में ऊर्जा स्तर A से C में संक्रमण में 1000Å तथा ऊर्जा स्त...
Text Solution
|