Text Solution
Verified by Experts
The correct Answer is:


Topper's Solved these Questions
STATISTICS
OSWAL PUBLICATION|Exercise NCERT CORNER (Exercise - 14.3)|7 VideosSTATISTICS
OSWAL PUBLICATION|Exercise NCERT CORNER (Exercise - 14.4)|3 VideosSTATISTICS
OSWAL PUBLICATION|Exercise NCERT CORNER (Exercise - 14.1)|9 VideosSOME APPLICATIONS OF TRIGONOMETRY (HEIGHTS AND DISTANCES)
OSWAL PUBLICATION|Exercise CASE-BASED MCQs |15 VideosSURFACE AREAS AND VOLUMES
OSWAL PUBLICATION|Exercise BOARD CORNER (LONG ANSWER TYPE QUESTIONS)|9 Videos
Similar Questions
Explore conceptually related problems
OSWAL PUBLICATION-STATISTICS-NCERT CORNER (Exercise - 14.2)
- The following table shows the ages of the patients admitted in a ho...
Text Solution
|
- The following data gives the information on the observed lifetimes ...
Text Solution
|
- The following data gives the distribution of total monthly househol...
Text Solution
|
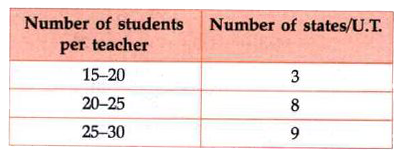
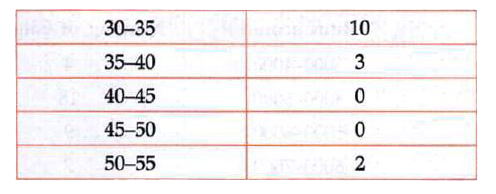
- The following distribution gives the state-wise teacher-student ratio ...
Text Solution
|
- The given distribution shows the number of runs scored by some top ...
Text Solution
|
- A student noted the number of cars passing through a spot on a road...
Text Solution
|