A
B
C
D
Text Solution
Verified by Experts
The correct Answer is:


Similar Questions
Explore conceptually related problems
Recommended Questions
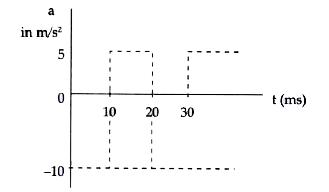
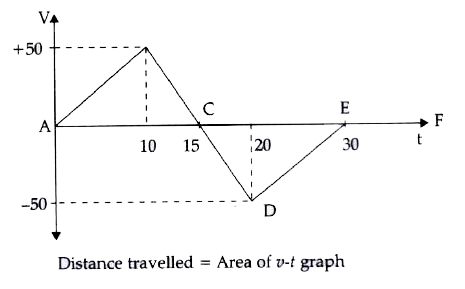
- Suppose that the acceleration versus time graph of a particle that sta...
Text Solution
|
- Figure shows the speed versus time graph for a particle. Find the dist...
Text Solution
|
- A particle starting from rest. Its acceleration (a) versus time (t) is...
Text Solution
|
- The position versus time graph of a particle moving along a straight l...
Text Solution
|
- The acceleration versus time graph for a particle moving along a strai...
Text Solution
|
- A particle is moving in a straight line. Particle was initially at res...
Text Solution
|
- A graph of acceleration versus time of a particle starting from rest a...
Text Solution
|
- Acceleration - time graph for a particle is given in figure. If it sta...
Text Solution
|
- Figure shows the speed versus time graph for a particle. Find the dist...
Text Solution
|