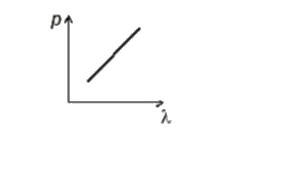
A
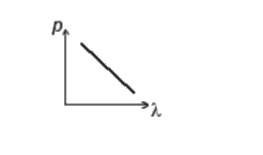
B

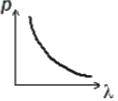
C
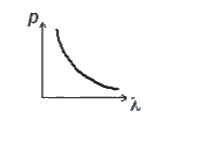
D
Text Solution
Verified by Experts
The correct Answer is:


Topper's Solved these Questions
Similar Questions
Explore conceptually related problems
NTA MOCK TESTS-NTA TPC JEE MAIN TEST 104-PHYSICS (SUBJECTIVE NUMERICAL)
- Which of the following figure represents the variation of particle mom...
Text Solution
|
- In the Coolidage tube experiment, if the applied voltage is increased ...
Text Solution
|
- In a Wheatstone's network, P=2Omega, Q=2Omega, R=2Omega and S=3Omega. ...
Text Solution
|
- A solid sphere of radius R has a charge Q distributed in its volume wi...
Text Solution
|
- A body released from a great height, falls freely towards the earth. A...
Text Solution
|
- A body of mass 5 kg starts from the origin with an initial velocity ve...
Text Solution
|
- A stationary source is emitting sound at a fixed frequency f(0), which...
Text Solution
|
- A concrete sphere of radius R has cavity of radius r which is packed w...
Text Solution
|
- If the distance between the virtual image from Its real object is 60 c...
Text Solution
|
- A source of monochromatic light of wavelength 0.6 mum is placed at a ...
Text Solution
|
- Power applied to a particle varies with time as P =(3t^(2)-2t + 1) wat...
Text Solution
|