A
B
C
D
Text Solution
Verified by Experts
The correct Answer is:


Similar Questions
Explore conceptually related problems
Recommended Questions
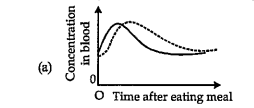
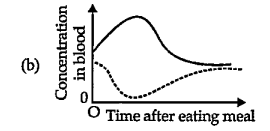
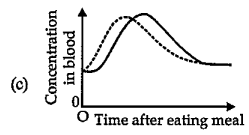
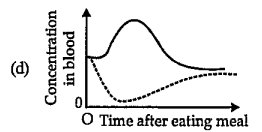
- The graphs show the concentration of glucose and insulin in the blood ...
Text Solution
|
- The blood concentration of glucose in a normal healthy individual is
Text Solution
|
- सामान्य स्वस्थ मनुष्य के रुधिर में भोजन पूर्व ग्लूकोज का स्तर कितना हो...
Text Solution
|
- किसी कोशिका में ग्लूकोज के अंतर्ग्रहण की दर को ग्राफ में दर्शाया गया ह...
Text Solution
|
- The concentration of glucose in blood in a normal healthy individual i...
Text Solution
|
- A graph shows change after a lunch of a healthy individual whose diet ...
Text Solution
|
- The blood concentration of glucose in a normal healthy individual is
Text Solution
|
- The given bar diagram shows the relative amount of glucose and insulin...
Text Solution
|
- Which blood vessel will contain a high amount of glucose and amino aci...
Text Solution
|