A
B
C
D
Text Solution
Verified by Experts
The correct Answer is:


Similar Questions
Explore conceptually related problems
Recommended Questions
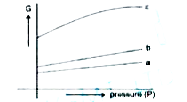
- The following curve represents the variation of Gibbs function 'G' wit...
Text Solution
|
- A hot liquid is kept in a big room. Its temperature is plotted as a fu...
Text Solution
|
- Identify the correct statement for change of Gibbs energy for a system...
Text Solution
|
- The given curve represents the variation of temperature as a function ...
Text Solution
|
- The changes in gibbs energy (Delta G) of a system for a process at con...
Text Solution
|
- The following figure represents the temperature versus time plot for a...
Text Solution
|
- The following curve represnets the variation of Gibbs function 'G' wit...
Text Solution
|
- The following curve represents the variation of Gibbs function 'G' wit...
Text Solution
|
- A hot liquid is kept in a big room. Its temperature is plotted as a fu...
Text Solution
|