Text Solution
Verified by Experts


Similar Questions
Explore conceptually related problems
Recommended Questions
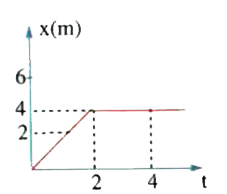
- In the figure given, the position-time graph of a particle of mass 0.1...
Text Solution
|
- For a particle moving along the x-axis, x-t graph is as given as graph...
Text Solution
|
- In the figure given below, the position-time graph of a particle of ma...
Text Solution
|
- In the figure given below, the position time graph of a particle of ma...
Text Solution
|
- The position-time graph of a particle of mass 0.1 kg is shown. The imp...
Text Solution
|
- In the figure, the position time graph of a particle of mass 0.1 kg is...
Text Solution
|
- In the figure given below, the position–time graph of a particle of ma...
Text Solution
|
- The displacement of a particle as a function of time is shown in figur...
Text Solution
|
- In the figure given, the position-time graph of a particle of mass 0.1...
Text Solution
|