Home
Class 12
PHYSICS
The speed-time graph of a particle movin...

The speed-time graph of a particle moving along a fixed direction is shown in Fig. Then which of the following is wrong?

A

A) distance travelled by the particle in 10 sec is 60 m.

B

B) average speed in 10 sec is 6 m/s.

C

c) average speed between t=2, t=6 sec is 9m/s

D

D) average speed between t=2, t=6 sec is 6 m/s

Text Solution

Verified by Experts

The correct Answer is:
D
Promotional Banner

Topper's Solved these Questions

  • APPENDICES (REVISION EXERCISE)

    AAKASH SERIES|Exercise MOTION IN A PLANE|87 Videos
  • APPENDICES (REVISION EXERCISE)

    AAKASH SERIES|Exercise LAW OF MOTION|128 Videos
  • APPENDICES (REVISION EXERCISE)

    AAKASH SERIES|Exercise LAW OF MOTION|128 Videos
  • APPENDICES ( REVISION EXERCISE )

    AAKASH SERIES|Exercise REVISION EXERCISE (MAGNETISM AND MATTER )|52 Videos
  • ATOMS

    AAKASH SERIES|Exercise PRACTICE EXERCISE|21 Videos

Similar Questions

Explore conceptually related problems

The speed-time graph of a particle moving along a fixed direction is shown in the Fig. The distance traversed by the particle between (a) t=0 s to 10 s . . what is the average speed of the particle over the intervals?

The speed-time graph of a particle moving along a fixed direction as shown in the figure. The distance traversed by the particle between t = 0 s to t = 10 s is

The speed-time graph of a particle moving along a fixed direction is shown in the Fig. 2 (CF) . 15. The distance traversed by the particle between t= 2 s and 6 s is . .

The acceleration (a)-time(t) graph for a particle moving along a straight from rest is shown in figur. Which of the following graph is the best representation of its velocity (v) with time (t) ?

The acceleration (a)-time(t) graph for a particle moving along a straight from rest is shown in figure. Which of the following graph is the best representation of its velocity (v) with time (t) ?

Displacement time graph of a particle moving in a straight line is a shown in figure.

The x-t graph of a particle moving along a straight line is shown in figure The speed-time graph of the particle is correctly shown by

Position-time graph for a particle moving along x- direction is as shown in the figure. Average speed of the particle from t = 0 to t = 4 is :

The force acting on a particle moving along a straight line varies with time as shown in diagram. Which of the following graphs is best representative of its speed and time graphs. Initial velocity the particle is zero.

The force acting on a particle moving along a straight line varies with time as shown in diagram. Which of the following graphs is best representative of its speed and time graphs. Initial velocity the particle is zero.

AAKASH SERIES-APPENDICES (REVISION EXERCISE)-MOTION IN A STRAIGHT LINE
  1. On a two-lane road, car A is travelling with a speed of 36 km h^(-1). ...

    Text Solution

    |

  2. Two towns A and B are connected by a regular bus service with a bus le...

    Text Solution

    |

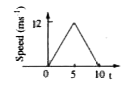
  3. The speed-time graph of a particle moving along a fixed direction is s...

    Text Solution

    |

  4. Two cars start in a race with velocities u(1) and u(2) and travel in a...

    Text Solution

    |

  5. STATEMENT-1 : For solution of volatile liquids, the partial vapour pre...

    Text Solution

    |

  6. The displacement x of a particle varies with time according to the rel...

    Text Solution

    |

  7. The acceleration (a) of a particle depends on displacement (s) as a =...

    Text Solution

    |

  8. A train takes t sec to perform a journey , if travel for t/n sec with ...

    Text Solution

    |

  9. On fogy day two drivers spot in front of each other when 80 m apart, t...

    Text Solution

    |

  10. A particle moving along straight line has velocity v = mu s where s is...

    Text Solution

    |

  11. A bird is tossing (flying to and fro) between two cars moving towards ...

    Text Solution

    |

  12. On a long horizontally moving belt (Fig.3.26), a child runs to and fro...

    Text Solution

    |

  13. A stone is dropped from a hill of height 180 m. Two seconds later anot...

    Text Solution

    |

  14. Water drops fall from the roof a building 20 m high at regular time in...

    Text Solution

    |

  15. A body is dropped from a height of 16 m. The body strikes the ground a...

    Text Solution

    |

  16. The distance travelled by a falling body in the last second of its mot...

    Text Solution

    |

  17. A ball dropped from a point P crosses a point Q in t seconds. The time...

    Text Solution

    |

  18. Two balls are dropped from the same height at two different places A a...

    Text Solution

    |

  19. A lead ball dropped into a lake from a diving board 5 m above the wate...

    Text Solution

    |

  20. A body P is thrown vertically up with velocity 30 ms^(-1) and another ...

    Text Solution

    |