Text Solution
Verified by Experts


Similar Questions
Explore conceptually related problems
Recommended Questions
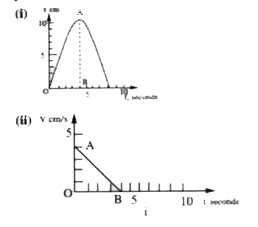
- The graphs in (i) and (ii) show the S-t graph and V -t graph of a body...
Text Solution
|
- Figure shows the displacement tiime (x-t) graph of a body moving in a ...
Text Solution
|
- Column-I shows a-t graph and column-II shows v-t graph. Mathc the colu...
Text Solution
|
- Represent uniform motion on a v - t graph.
Text Solution
|
- Represent uniform accelerated motion on a s-t graph.
Text Solution
|
- Represent a body in uniform accelerated motion on a a - t graph.
Text Solution
|
- Represent the following v - t graph on a a - t graph.
Text Solution
|
- Represent the following a-t graph on a v-t graph.
Text Solution
|
- Represent the following a-t graph on a v-t graph.
Text Solution
|