Text Solution
Verified by Experts


Similar Questions
Explore conceptually related problems
Recommended Questions
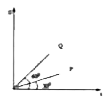
- The displacement-time graphs of two particles P and Q are as shown in ...
Text Solution
|
- The displacement-time graph for two particles is as shown. Find the ra...
Text Solution
|
- The displacement time graphs of two bodies A and B are shown in figure...
Text Solution
|
- The velocity-time graph for a particle moving along X-axis is shown in...
Text Solution
|
- The velocity time graph for a particle moving along x-axis is shown in...
Text Solution
|
- The figure shows a velocity-time graph of a particle moving along a st...
Text Solution
|
- The velocity time graph for a particle moving along X-axis is shown in...
Text Solution
|
- velocity time graph of a particle is shown in figure. Find displacemen...
Text Solution
|
- The acceleration-displacement graph of two particles P and Q exeucting...
Text Solution
|