Home
Class 12
BIOLOGY
When two plants L and M were exposed to ...

When two plants L and M were exposed to different light intensities and temperature they showed changes in their rates of photosynthesis. Which have been represented in the following graph.

The graph indicates that

A

Plant L is a `C_3` plant for which the light saturation point is 100% of full sunlight .

B

Plant M is a `C_4` plant for which the optimum temperature is around `20^@C`

C

Plant M is a `C_3` plant which is more affected at higher temperature and higher light intensity as compared to plant L

D

Plant L is a `C_4` plant and cannot function at light intensities above the saturation point

Text Solution

Verified by Experts

The correct Answer is:
C
Promotional Banner

Topper's Solved these Questions

  • PHOTOSYNTHESIS IN HIGHER PLANTS

    AAKASH SERIES|Exercise Exercise - II|33 Videos
  • PHOTOSYNTHESIS IN HIGHER PLANTS

    AAKASH SERIES|Exercise Exercise - III|27 Videos
  • ORGANISMS AND POPULATIONS

    AAKASH SERIES|Exercise EXERCISE-III (PREVIOUS AIPMT/NEET QUESTIONS)|35 Videos
  • PLANT GROWTH AND DEVELOPMENT

    AAKASH SERIES|Exercise EXERCISE -III (PREVIOUS AIPMT/NEET QUESTIONS)|27 Videos

Similar Questions

Explore conceptually related problems

Study the given graph showing the efect of light intensity on the rate of photosynthesis. Which of the following statemetns regarding this is correct?

Which of the following option is correct for the object having a staright line motion represented by the following graph?

The graph showing rate of Photosynthesis at different wavelengths of light is called

Which of the following options is correct for the object having a straight line motion represented by the following graph ?

For the following temperature-time graph, in which region the state of material changes

Which of the following graphs correctly depicts the rate of photosynthesis of sun plant (P) and shade plant (Q)?

Observe the given graph carefully and choose the correct statements for labelled points, (A to E) "gt Points:- (A)- There is a linear relationship between incident light and CO_(2) fixation rates. (B)- It is a transition poit where limiting factor changes. (C)- At this region light intensity is not showing detrimental effect on rate of photosynthesis. (D)- It shows light saturation point sunlight except for plants in shade or in dense forests. (E)- This point show maximum rate of photosynthesis at optimum presence of various parameters.

The graph above shows y=2x. Which of the following graphs represents y=|2x| ?

If the accomanying figure above shows the graph of function f, which of the following could represent the graph of y=f(x+1) ?

The graph shows the correlation between ambient air temperature, t, in degress Fahrenheit and the number of chirps, c, per minute that a snowy tree cricket makes at that temperature. Which of the following equations represents the line shown in the graph ?

AAKASH SERIES-PHOTOSYNTHESIS IN HIGHER PLANTS -Exercise - III
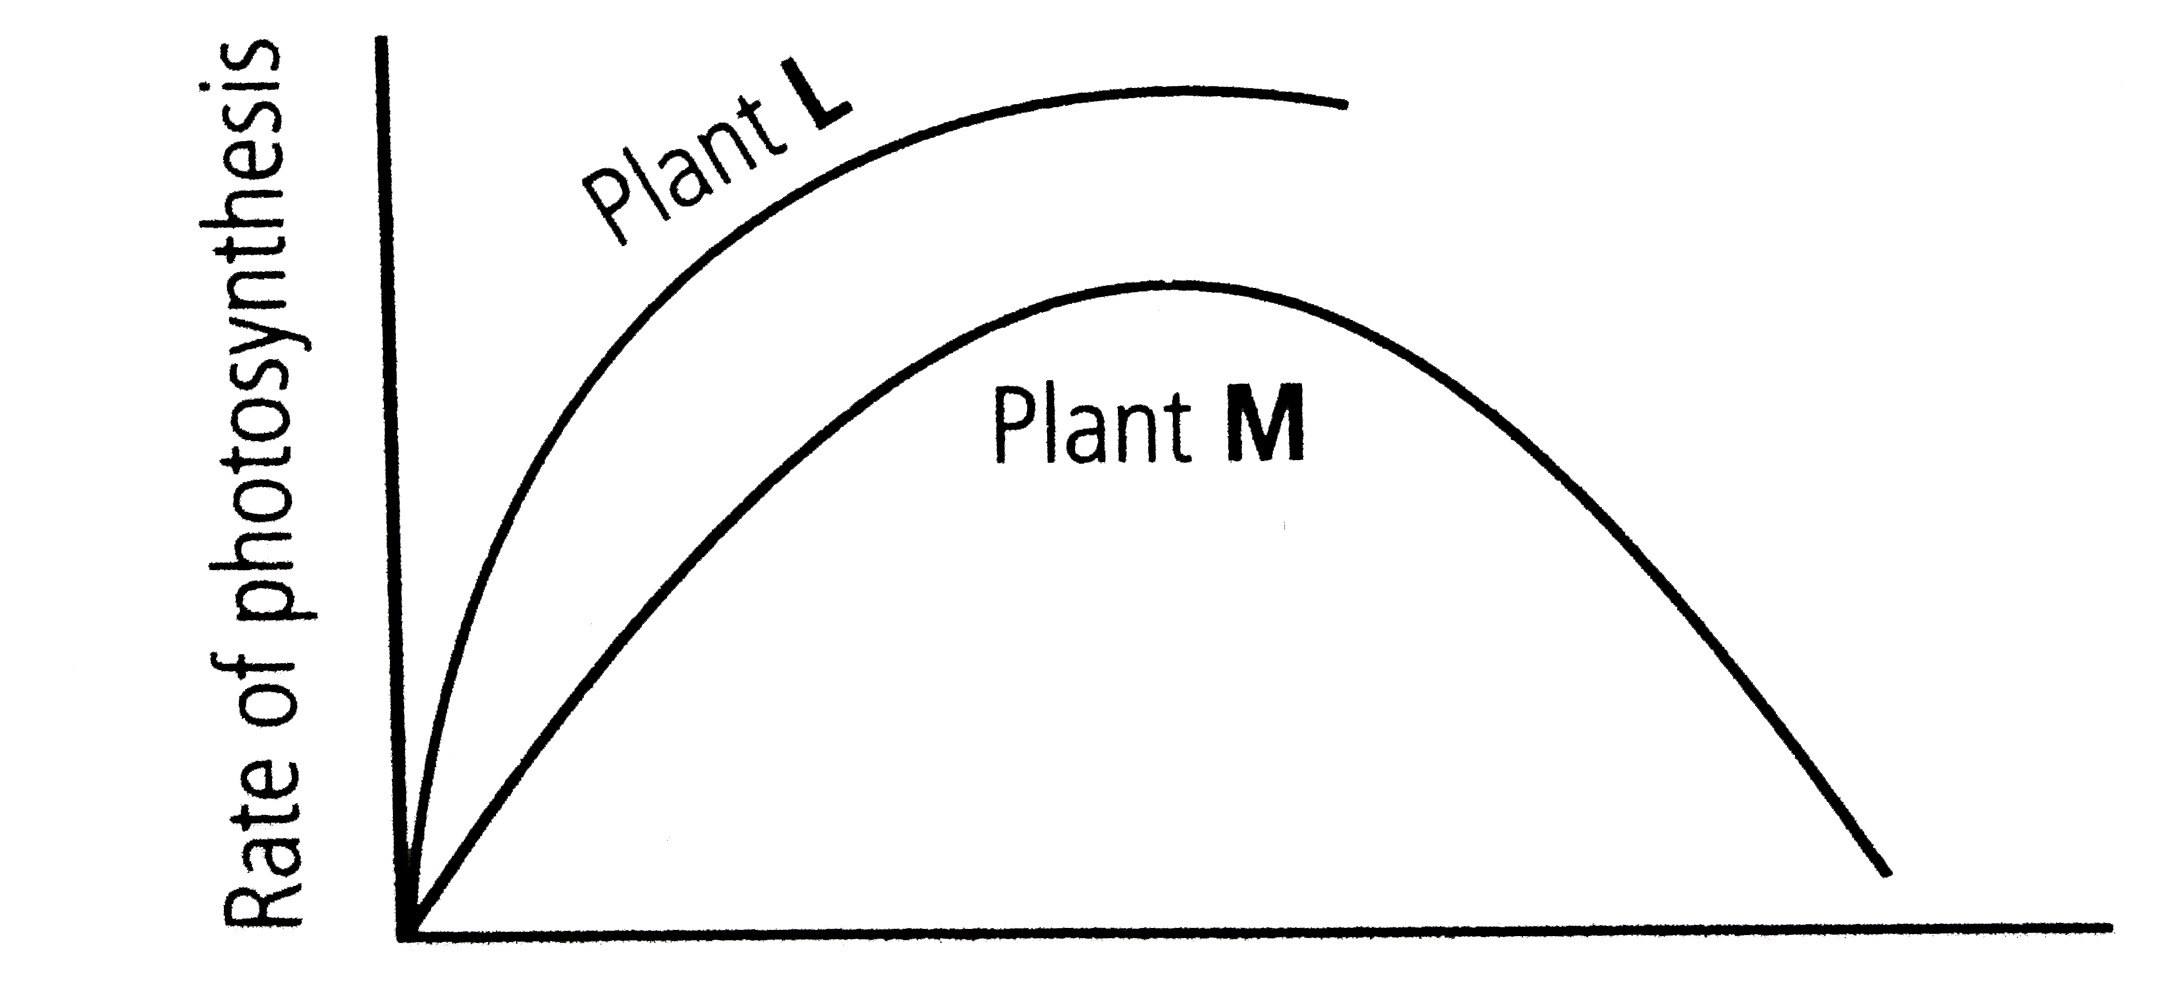
  1. When two plants L and M were exposed to different light intensities an...

    Text Solution

    |

  2. Phosphoenol pyruvate (PEP) is the primary CO(2) acceptor in

    Text Solution

    |

  3. With reference to factors affecting the rate of Photosynthesis, which ...

    Text Solution

    |

  4. Emerson's enhancement effect and Red drop have been instrumental in th...

    Text Solution

    |

  5. Oxygenic photosynthesis occurs in

    Text Solution

    |

  6. Anoxygenic photosynthesis is characteristic of

    Text Solution

    |

  7. Transition state structure of the substrate fomed during an enzy...

    Text Solution

    |

  8. An alga which can be employed as food for human being is

    Text Solution

    |

  9. Read the following four statements (A-D) - (A) Both, photophosphoryl...

    Text Solution

    |

  10. Which one of the following organisms is correctly matched with its thr...

    Text Solution

    |

  11. A Process that makes important differences between C(3) and C(4) plant...

    Text Solution

    |

  12. Kranz anatomy is typical of

    Text Solution

    |

  13. A Process that makes important differences between C(3) and C(4) plant...

    Text Solution

    |

  14. The correct sequence of cell organelles during photorespiration is

    Text Solution

    |

  15. Of the total incident solar radiation the proportion of PAR is

    Text Solution

    |

  16. CAM helps the plants in

    Text Solution

    |

  17. In kranz anatomy, the bundle sheath cells have

    Text Solution

    |

  18. PGA as the first CO(2)-fixation product was discovered in photosynthes...

    Text Solution

    |

  19. C(4) plants are more efficent in photosynthesis than C(3) plants due t...

    Text Solution

    |

  20. Study the pathway given below : in which of the following options...

    Text Solution

    |

  21. Read the following four statements, A, B, C and D select the right opt...

    Text Solution

    |