A
B
C
D
Text Solution
Verified by Experts
The correct Answer is:


Similar Questions
Explore conceptually related problems
Recommended Questions
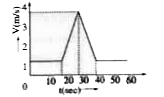
- Velocity-time (v-t) graph for a moving object is shown in the figure. ...
Text Solution
|
- Velocity-time graph for a moving object is shown in the figure. Total ...
Text Solution
|
- The graph shown the variation with times t of the velocity v of an obj...
Text Solution
|
- निम्नांकित चित्र (a) में एक गतिशील वस्तु का समय-विस्थापन ग्राफ प्रदर...
Text Solution
|
- चित्र में किसी वस्तु के लिए त्वरण-समय ग्राफ प्रदर्शित किया गया है। इसी...
Text Solution
|
- Velocity - time graph of a moving object is shown below. What is the a...
Text Solution
|
- किसी गतिशील वस्तु का वेग-समय ग्राफ चित्र में दर्शाया गया है। उस समयान्...
Text Solution
|
- किसी वस्तु के लिये त्वरण-समय ग्राफ चित्र में दिखाया गया है। तो संगत वे...
Text Solution
|
- किसी गतिशील वस्तु का वेग-समय ग्राफ चित्र में दर्शाया गया है। उस समयान्...
Text Solution
|