Text Solution
Verified by Experts


Similar Questions
Explore conceptually related problems
Recommended Questions
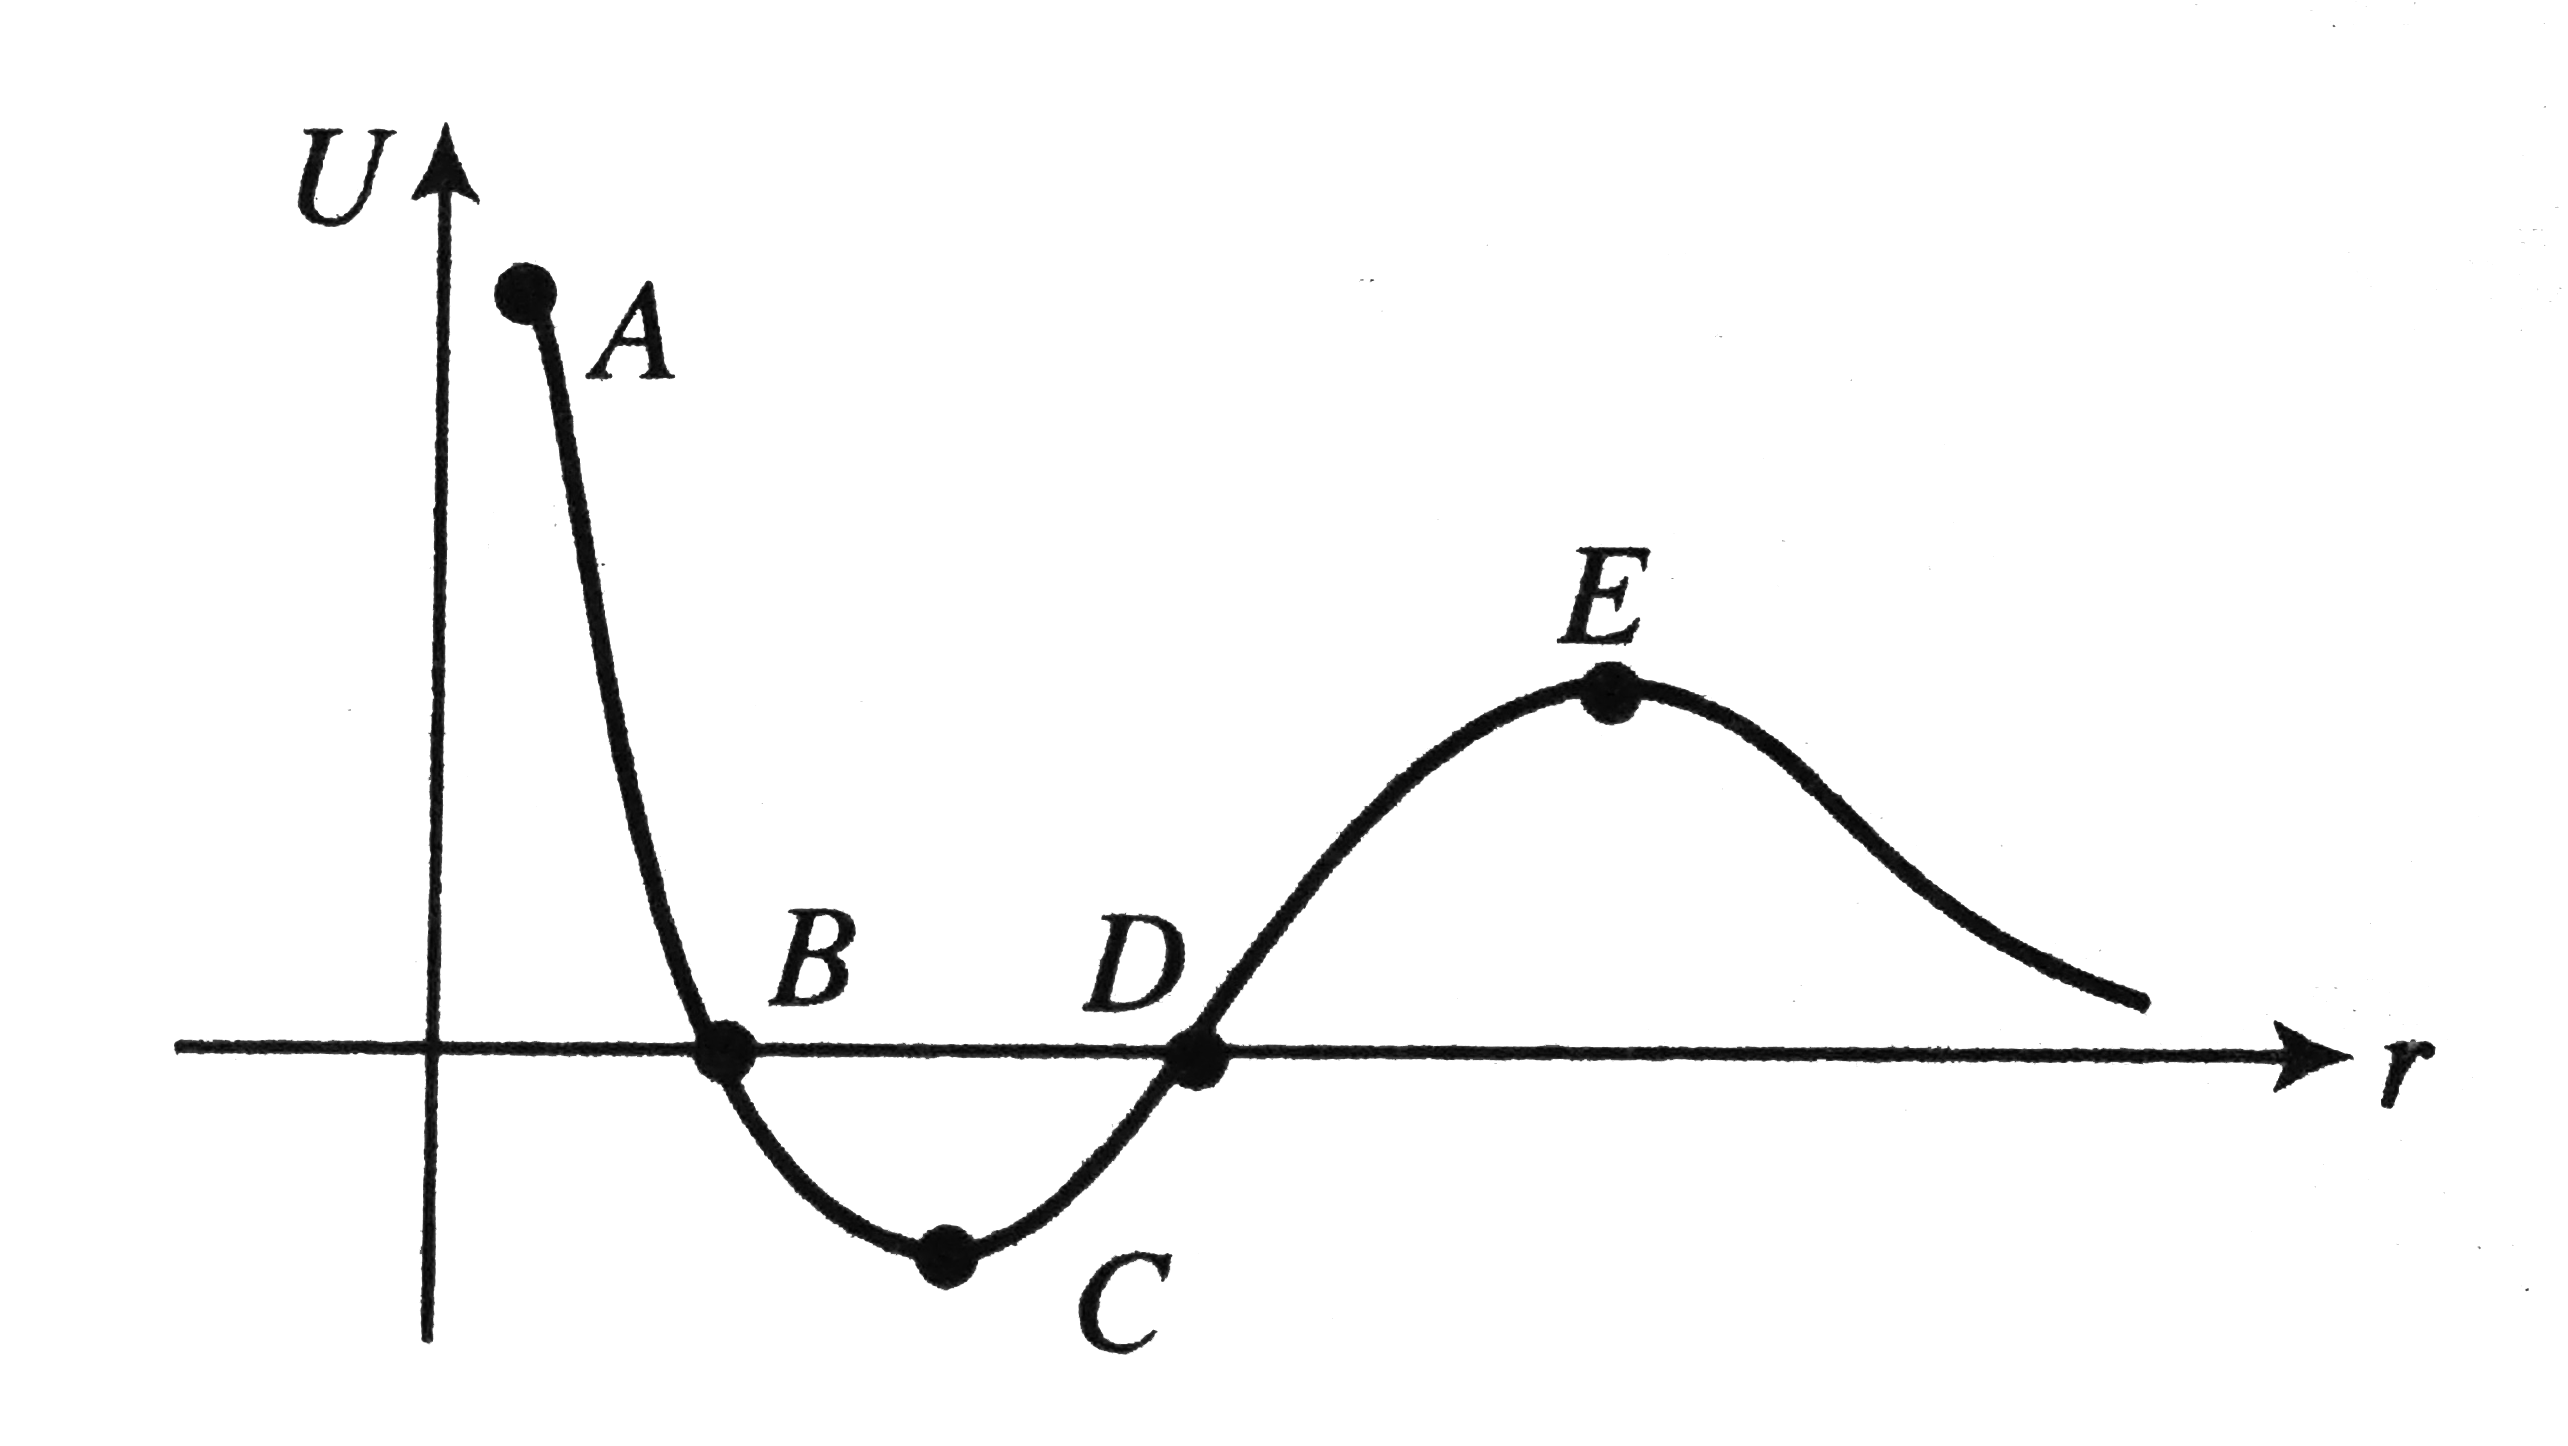
- The given plot shows the variation of U, the potential energy of inter...
Text Solution
|
- The given plot shows the variation of U, the potential energy of inter...
Text Solution
|
- Two point masses A and B having masses in the ratio 4:3 are separated ...
Text Solution
|
- If the distance between the two particles is increased by 2% , then th...
Text Solution
|
- Two point charges separated by a distance d repel each other with a f...
Text Solution
|
- If the distance between two point particles is doubled, then the gravi...
Text Solution
|
- If the potential energy between two molecules is given by U= -(A)/(r^6...
Text Solution
|
- If the potential energy between two molecules is given by U= -(A)/(r^6...
Text Solution
|
- The given plot shows the variation of U, the potential energy of inter...
Text Solution
|